Your dashboard is packed with numbers. Revenue graphs, customer counts, marketing spend, it's all there. But when someone asks you a straightforward question like "What's your customer acquisition cost?" or "How's your retention looking?", do you have a clear answer?
If you had to pause just now, you're not alone. Most SaaS teams are drowning in data but starving for actual insights. They're tracking everything, yet somehow making decisions based on gut feel when it really counts.
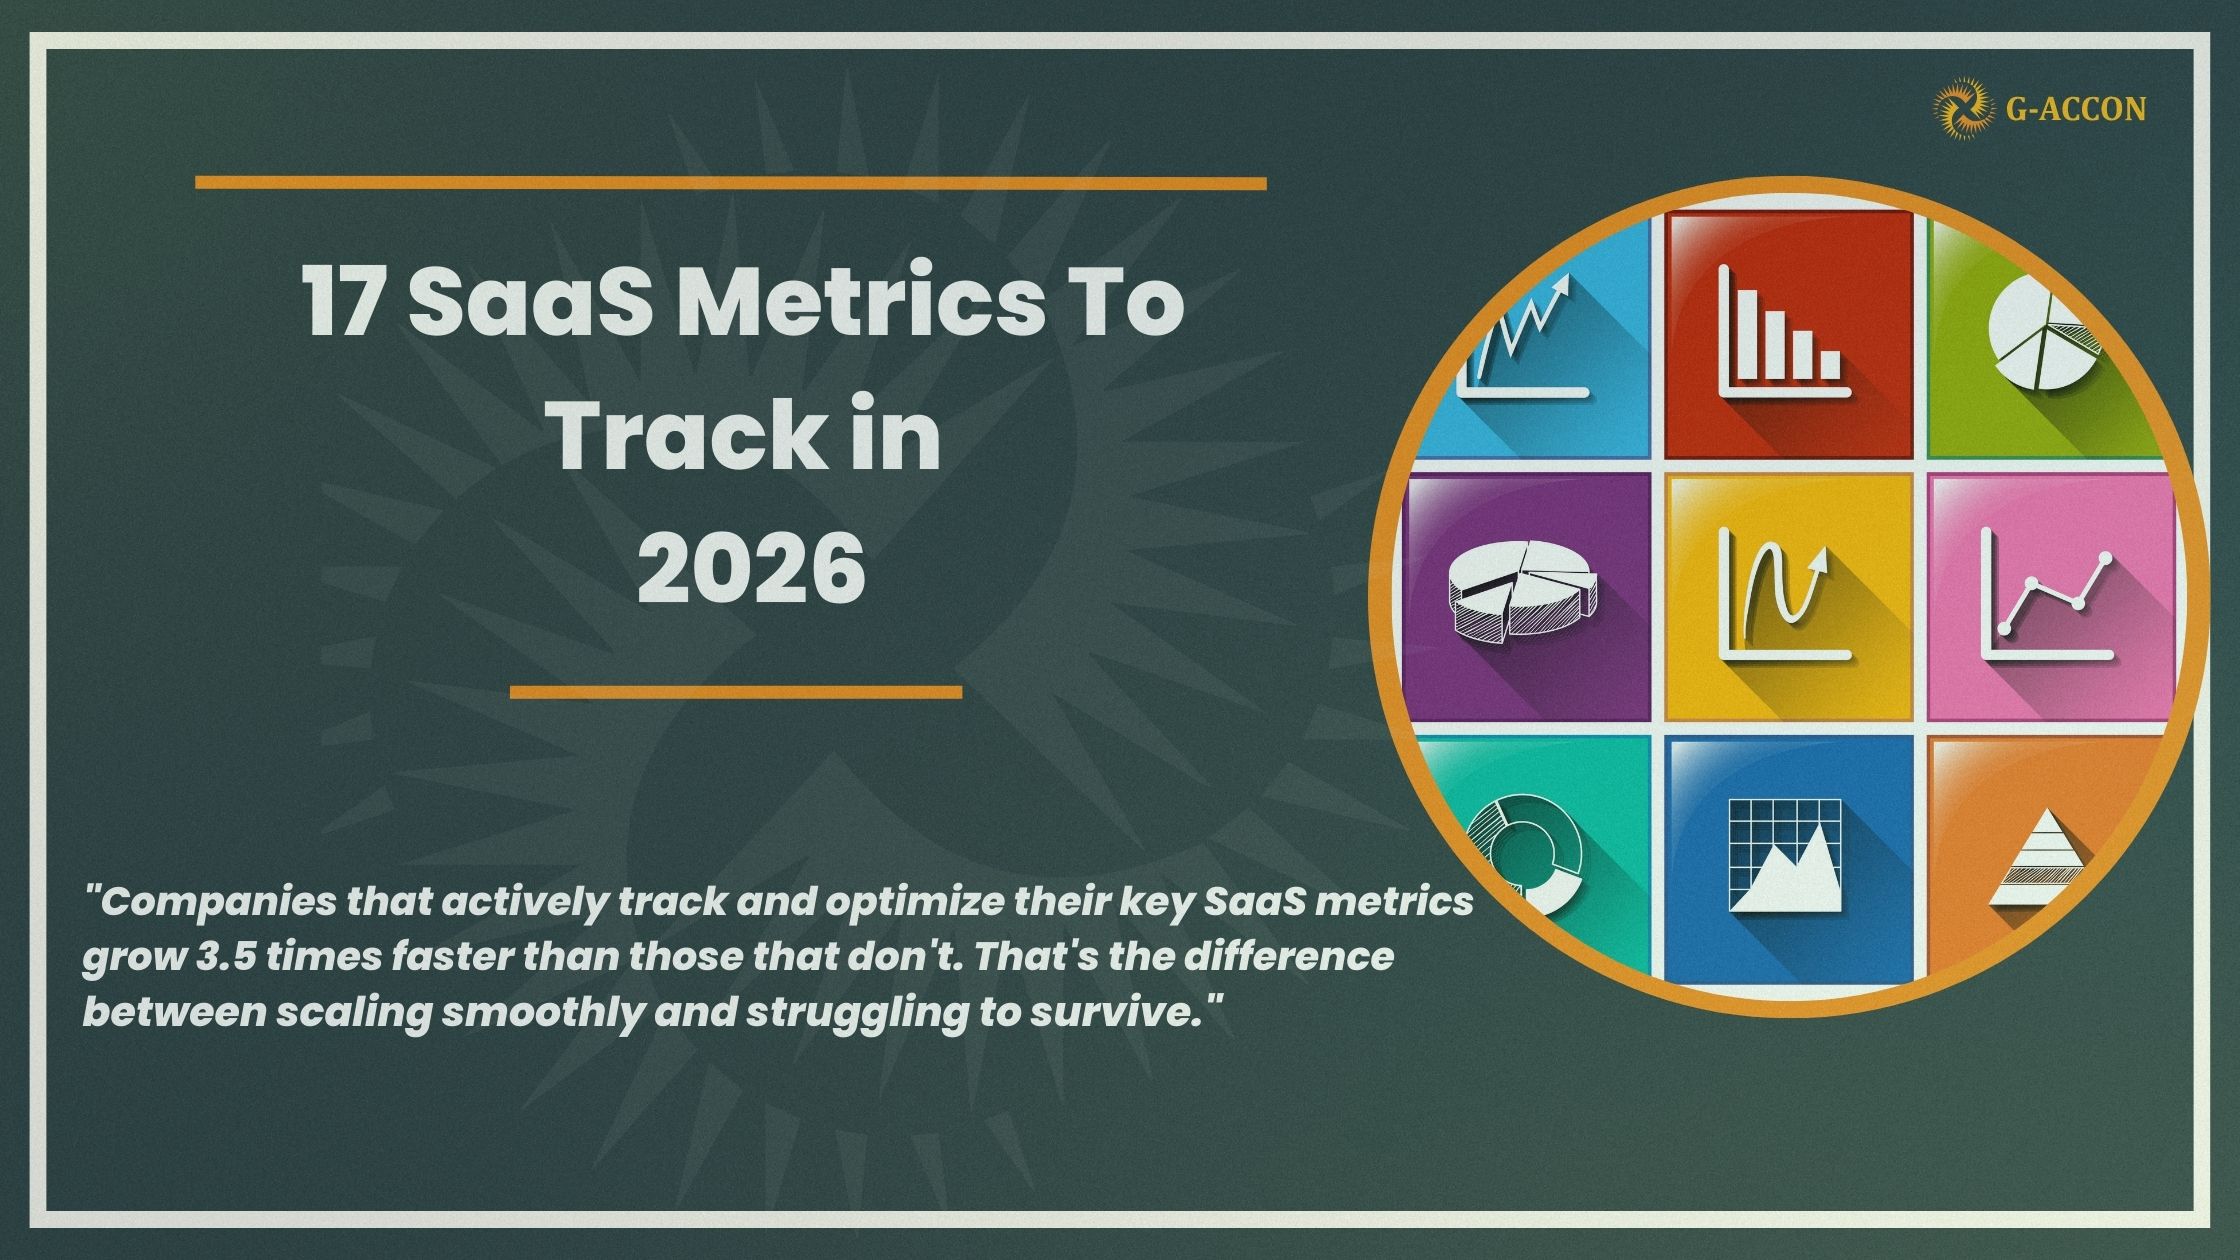
Here's what the data shows: companies that actively track and optimize their key SaaS metrics grow 3.5 times faster than those that don't. That's not a small advantage; that's the difference between scaling smoothly and struggling to survive.
The gap between success and failure often comes down to one thing: knowing which metrics actually matter and tracking them consistently.
What is a SaaS Metric?
A SaaS metric is a specific measurement that shows how your software business is performing. Think of it like a health check for your company. Just like a doctor tracks your blood pressure and heart rate to understand your physical health, SaaS metrics track things like how much money you're making each month, how many customers are staying with you, and how much it costs to get new customers.
These numbers help you answer important questions: Is your business growing? Are customers happy? Are you spending money wisely?
The key is that SaaS metrics are designed specifically for subscription-based software companies, which work differently from traditional businesses. Instead of one-time sales, you're focused on keeping customers paying month after month, so the metrics you track reflect that unique business model.
Why SaaS Metrics Matter More Than Ever
The SaaS landscape has shifted hard in the past few years. Remember when everyone was obsessed with growth at all costs? Burn cash, grab market share, worry about profits later? That era is over. Dead and buried.
Now, investors want sustainable growth, efficiency, and proof that your business model actually works. And honestly? That's healthier for everyone.
But here's the catch: you can't improve what you don't measure. Consider this: increasing customer retention by just 5% can boost profits anywhere from 25% to 95%. That's not some made-up number. That's the real impact of keeping customers happy.
Yet most teams don't even know their actual retention rate; they most often end up guessing. And when you're guessing with numbers this important, you're leaving serious money on the table.
The good news? Once you start tracking the right metrics, everything becomes clearer. Decisions get easier. Problems reveal themselves before they become disasters. And your team finally aligns around what actually moves the needle.
Let's dig into the 17 metrics that'll give you that clarity.
Marketing and Sales SaaS Metrics
1Qualified Leads
Not all leads are created equal. Anyone can buy a list or run ads and fill up a CRM with names. That's easy.
What's hard, and what matters, is generating qualified leads. People who actually fit your ideal customer profile. Companies that have the budget for your solution. Decision-makers with real pain points you can solve.
Think about it this way: would you rather have 1,000 random email addresses or 50 leads from companies that perfectly match your best customers? The answer should be obvious.
When tracking qualified leads, be ruthless about what "qualified" actually means. Does this person work at a company that could use your product? Do they have decision-making power? Do they have a budget allocated?
If any answer is no, they're not really a lead. They're just a contact in your database.
How to measure:
2Lead Velocity Rate (LVR)
This metric is sneaky powerful because it shows you the future.
Your revenue today is the result of sales you closed weeks or months ago. But lead velocity tells you what your revenue will look like in three to six months.
The question is simple: Are you generating more qualified leads this month than last month? By how much?
That trend line is basically a preview of your pipeline health. If it's climbing, you're building momentum. If it's flat or dropping, you need to fix your marketing yesterday.
The formula:
A growing LVR means your pipeline is getting stronger, while a shrinking one means trouble is coming.
3Conversion Rate
Here's what makes conversion rate so valuable: you can apply it everywhere in your business, and it immediately shows you where things are breaking.
Think of your customer journey as a series of steps:
- Website visitor → Free trial signup
- Trial signup → Active user
- Active user → Paying customer
At each step, some people move forward and some drop off. Your job is figuring out where the biggest leaks are.
Maybe your website converts great, but your trial-to-paid conversion is terrible. That tells you something specific: your onboarding or product experience needs work.
Or maybe nobody's even getting to your pricing page; that's a different problem. Your messaging might be off, or your value proposition isn't clear.
You can't fix what you can't see. Track conversions at every major step, and the weak points will announce themselves.
Basic formula:
4Leads to Opportunities
Here's where your sales process really kicks in.
A lead is anyone in your system. An opportunity is an actual deal your sales team is actively pursuing. The gap between those two numbers reveals a lot about your qualification process.
If you've got thousands of leads but very few opportunities, something's off. Either your leads aren't qualified (see #1), or your sales team isn't moving things forward aggressively enough.
On the flip side, if almost every lead becomes an opportunity, your team might be wasting time on deals that'll never close. Sometimes the smartest move is to disqualify fast and move on.
5Opportunities to Closed Won Deals
This is your close rate, and it matters more than almost any other sales metric.
In a healthy SaaS business, you should be closing somewhere between 20-30% of qualified opportunities. It varies by business model; enterprise deals might close higher, pure self-service might be lower.
But the trend is what really matters. Is your close rate improving or dropping? If it's falling, you need to know why immediately.
Are deals getting lost to competitors? Are objections not being handled well? Are the opportunities even qualified in the first place?
The formula:
Every lost deal is a learning opportunity. The best sales teams do post-mortems on losses and look for patterns they can fix.
The Money Metrics
6Customer Acquisition Cost (CAC)
This is probably the most important metric that early-stage SaaS companies calculate wrong.
CAC isn't just your ad spend. It's everything: marketing budget, sales salaries, software tools, events, swag, all of it. Then you divide that total by the number of new customers you actually acquired.
Too many companies say, "Our CAC is only $500!" Then, when someone actually sits down and calculates it properly, it's more like $3,000 or $4,000.
And look, that might be fine depending on what your customers are worth. But you need to know the real number, not the number you wish it were.
The formula:
Once you know your true CAC, you can make informed decisions about where to invest and what channels actually work.
7Average Revenue Per User (ARPU)
Also called Average Revenue Per Account (ARPA), the name doesn't matter as much as what you do with the information.
ARPU shows you the average amount each customer pays you, but the real power comes when you start breaking it down by segment.
What's the ARPU for enterprise customers versus SMB customers? For customers in tech versus healthcare? For annual contracts versus monthly subscriptions?
Those differences tell you where to focus your sales efforts. If enterprise customers pay 10x what SMB customers do, and the sales cycle is only twice as long, that's a pretty clear signal about where your team's time is best spent.
The formula:
8Monthly Recurring Revenue (MRR)
This is the heartbeat of your SaaS business. The predictable revenue you can count on every single month from subscriptions.
What makes MRR so valuable is that it cuts through all the noise; new customers, upgrades, downgrades, cancellations, everything shows up in this one number.
When you track it over time, patterns emerge; maybe December is always slow. Maybe September brings a bump. Whatever the trends are, MRR makes them visible.
And when you connect your accounting software, like QuickBooks or Xero, to Google Sheets with tools like G-Accon, your MRR updates automatically. No more manual exports, no more formula errors, just live data refreshing on schedule.
The formula:
9Annual Recurring Revenue (ARR)
ARR is MRR's big brother, the same concept zoomed out to show the yearly picture. This is the number investors care about most. It's what you use for annual planning and budgeting.
And it smooths out those month-to-month fluctuations so you can see your real trajectory. If your MRR bounces around but your ARR keeps climbing steadily, you're in good shape. The monthly noise doesn't matter as much as the long-term trend.
The formula:
The Post-Sale SaaS Metrics That Predict Success
10Closed Business to Project
If you have any kind of onboarding or implementation process, pay close attention here.
How long does it take from when someone signs the contract to when they actually start using your product?
Some companies have deals that sit for weeks or even months before the customer gets onboarded. That's lost time and lost value. And frankly, it's risky, the longer the gap, the more chance they'll get cold feet or find another solution.
What to track:
The faster you can move customers from "signed" to "onboarded," the stronger your relationship and the lower your risk of early churn.
11Projects to Revenue
Similar concept, different stage. Once someone's onboarded, how long until they're actually generating revenue?
This is especially critical if you have a free trial period or usage-based pricing. The faster you get people from "signed up" to "actively using and paying," the better your cash flow and customer satisfaction.
What to measure:
12Revenue Retention Rate
Revenue retention looks at how much money you keep after accounting for customers who cancel or downgrade. But here's where it gets interesting.
If you're doing expansion right, upsells, cross-sells, and usage growth, you can actually exceed 100% revenue retention. That's called net negative churn, and it's the holy grail for SaaS companies.
It means your existing customers are growing their spending faster than you're losing revenue from cancellations. When you hit that point, growth becomes dramatically easier because you're not on a treadmill just trying to replace lost revenue.
The formula:
Aim for at least 100%. Anything above that is pure gold.
Customer Health SaaS Metrics
13Customer Lifetime Value (CLV)
How much total revenue will you earn from one customer over your entire relationship?
This number is absolutely critical because it tells you how much you can afford to spend acquiring customers while still being profitable.
Here's the rule most successful SaaS companies follow: CLV should be at least 3x your CAC. That ratio gives you enough margin to be profitable and leaves room for error.
If you're spending $2,000 to acquire a customer who only pays you $4,000 total, you're cutting it way too close. You need either better retention, higher revenue per customer, or both.
Pro tip: A CLV to CAC ratio of 3:1 or higher is considered healthy. Below that, your unit economics need work.
The formula:
14Customer Retention Rate
This is the flip side of churn: what percentage of your customers stick around?
Here's something most people don't realize: it costs 5-7x more to acquire a new customer than to retain an existing one. Let that sink in.
Your existing customers are also the ones who buy more over time, refer their friends, and provide feedback that makes your product better. They're literally the foundation of your business.
High retention isn't just a nice-to-have. It's the difference between a struggling SaaS company and one that scales profitably.
The formula:
Shoot for 90% or higher. The best SaaS companies retain 95%+ of their customers month over month.
15Net Promoter Score (NPS)
NPS measures customer loyalty by asking one simple question: "How likely are you to recommend our product to a friend or colleague?" on a scale of 0-10.
Customers who respond with 9-10 are Promoters. They love your product and will actively recommend it. Customers who respond with 0-6 are Detractors. They're unhappy and might hurt your brand through negative word-of-mouth. Customers who respond with 7-8 are Passives, satisfied but not enthusiastic.
The formula:
The score can range from -100 (everyone's a detractor) to +100 (everyone's a promoter). Here's what to aim for:
- Above 0 is acceptable
- Above 20 is favorable
- Above 50 is excellent
- Above 80 is world-class
What makes NPS valuable isn't just the number itself. It's what you do with it. When you follow up with detractors to understand their frustrations, you uncover product issues and service gaps. When you follow up with promoters to ask for referrals or case studies, you turn happy customers into growth engines.
Track NPS quarterly at a minimum, and segment it by customer type, product tier, and time since onboarding. Those breakdowns show you where your product experience is strong and where it needs work.
16Monthly Revenue Per Product
If you've got multiple products or pricing tiers, you need to know which ones are actually making you money. Break down your MRR by product. The results will probably surprise you.
Usually, about 80% of revenue comes from 20% of offerings. That's the Pareto Principle in action, and it's incredibly useful information.
Maybe you discover that a product you thought was popular is actually only used by a tiny fraction of customers. Or maybe one pricing tier dominates all the others. That completely changes how you think about product roadmap and where to invest development resources.
The formula:
17Customer Churn Rate
Churn is the percentage of customers who cancel their subscriptions. And let's be clear, some churn is normal and unavoidable.
The average SaaS company loses about 3-5% of customers per month. If you're in that range, you're doing okay. Not great, but okay.
But if you're losing 10% or more? That's a massive red flag. Something's fundamentally wrong; either you're attracting the wrong customers, your product isn't delivering value, or your customer success team isn't effective.
High churn puts you on a treadmill. You're constantly having to replace lost customers just to stay flat, let alone grow. It's exhausting and unprofitable.
The formula:
Track this monthly. When it spikes, dig in immediately to understand why people are leaving.
Your Dashboard Strategy
Tracking all these metrics manually sounds exhausting, right? Because it is.
The most effective finance teams automate their reporting completely. They connect their accounting platforms, QuickBooks, Xero, Sage, and FreshBooks directly to Google Sheets using tools designed specifically for this purpose.
With G-Accon, your financial data syncs automatically. Your dashboards refresh on schedule. Your metrics update in real-time without manual exports or formula errors. That means your team spends time acting on insights instead of gathering data.
Want to see how professional dashboards work in practice?
Check out G-Accon's KPI Dashboard guide, which walks through setting up dynamic financial reporting with customizable templates that pull live data from your accounting system.
Imagine opening one spreadsheet and seeing all 17 of these metrics, updated live, with historical trends and automated alerts when something looks off. That's not a fantasy, that's just working smarter.
When you automate the busywork, you free up hours every week to focus on what actually matters: making better decisions, fixing problems faster, and growing more efficiently.
Where to Start Without Getting Overwhelmed
Look, 17 metrics are a lot, and if you're not tracking most of them right now, the idea of setting everything up might sound overwhelming.
So don't try to do it all at once. Start with these five core metrics. Get them dialed in, and you'll have 80% of what you need:
- Monthly Recurring Revenue (MRR) - Are you growing?
- Customer Acquisition Cost (CAC) - What does that growth cost?
- Customer Lifetime Value (CLV) - Is the growth profitable?
- Revenue Retention Rate - Is your base growing or shrinking?
- Customer Churn Rate - Are you keeping customers?
Master those first five. Track them consistently for at least two months. Get comfortable with what they're telling you about your business.
Then, as your needs grow and your operations get more complex, layer in the other metrics. Add lead velocity when forecasting becomes critical. Add conversion rates when you need to optimize your funnel. Add revenue per product when you're figuring out where to focus development.
But start simple. Five metrics, tracked consistently, will give you more clarity than most SaaS companies ever achieve.