If you ask most finance teams a simple question like “How much do customers owe us right now?” the answer is not always simple. Invoices sit in different systems. Some are current. Some are months late. Different branches or entities might each have their own view of the truth.
What is a Consolidated Aged Receivables Summary?
At its core, this report answers three questions:
- How much do customers owe
- How long have they owed it
- Which customers are slowing down your cash flow
Instead of showing every single invoice line, this report shows a summary. It groups outstanding amounts into time buckets. Common aging buckets include:
- Current, still within terms
- 31–60 days overdue
- 61–90 days overdue
- Over 90 days overdue
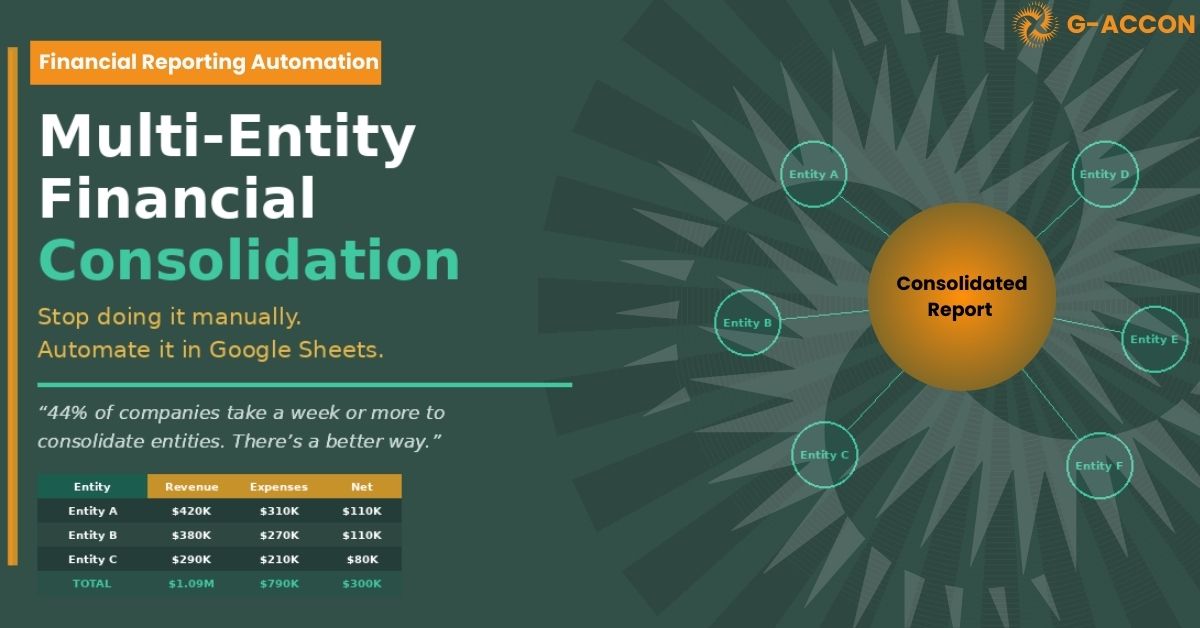
So, for each customer, you see totals in those buckets and a grand total at the end. If you are working across multiple entities or subsidiaries, a consolidated report brings all of them together in one view.
You are not just seeing one company’s receivables. You are seeing the full picture for the group.
Key features of the summary
Even though it is a summary report, it carries a lot of useful information.
First, it gives you a summarized view across customers, and if you choose, across entities. That means you can see:
- Total receivables for the group
- How much sits in each aging bucket
- Which customers are driving most of the overdue balance
Second, it uses aging categories that make sense for day-to-day work. Your team does not need to dig into raw dates. They can look at the “61–90 days” column and know those items need serious attention.
Third, a good consolidated aged receivables summary is not just a static list. In tools like G-Accon, the summary is often linked to detail. You can start at the high level and then drill into a customer to see the invoices behind their total. So you get both a quick overview and the option to go deeper when you need to.
Finally, the report is always tied to a specific date. For example, “As of 30 September 2025.” That time stamp matters because receivables change every day. New invoices go out. Customers pay some of their balance. Others slip from “Current” into “Overdue.” The report date tells you exactly when that snapshot was taken.
Why this report matters for cash flow
Why this report matters for cash flow
A consolidated aged receivables summary is not just an accounting checklist item. It is one of the most practical tools you can use to protect cash flow.
Late payments are very common. One 2025 accounts receivable study found that over 50% of global B2B invoices are overdue. That means a lot of the money you are counting on is often stuck in “not paid yet.”
When you look at this report, you can quickly see:
-
How much money do you expect to collect soon
-
How much is at risk because it is already late
-
Whether overdue balances are growing or shrinking over time
If you see a large amount in the “Over 90 days” bucket, that is a warning sign. It tells you that some customers might never pay in full, or that collections are not keeping up.
On the other hand, if most of your balance sits in the “Current” and “31–60 days” columns, with only a small slice in the oldest bucket, it suggests your credit and collections process is in better shape.
This single report gives you a quick health check without needing a long meeting or a complex dashboard.
Spotting high-risk customers early
Another big benefit of this summary is how it highlights repeat late payers.
If you look at the report week after week, you will notice patterns:
- Some customers always pay within terms
- Some drift into 31–60 days, but clear their balance soon after
- Some sit in 61–90 or 90+ days again and again
That last group is where your risk lives.
With a consolidated view, you can see if one customer is late across several entities at once. Maybe your UK company and your US company both sell to the same group, but each team thinks the customer is “not too bad.” The consolidated summary shows the full exposure in one place.
Armed with that information, you can:
- Tighten credit limits for certain customers
- Shorten payment terms for repeat late payers
- Ask for part payment up front before shipping more work
You stop guessing and start using data to manage risk.
Helping with better decisions and cleaner books
The report also supports day-to-day decisions inside finance.
It can help you:
- Decide which invoices to focus on during collection calls
- Estimate how much to set aside for bad debt
- Review whether your current credit policy is too loose or too strict
From an accounting point of view, the consolidated aged receivables summary also supports reconciliation work. When the totals in the report match your accounts receivable balance in the general ledger, you know the books are lined up. If something does not match, the report is a good starting point to find the problem.
How teams usually build this report without G-Accon
Many teams still build this type of report manually.
The process often looks like this:
- You log in to each QuickBooks company.
- You run an aged receivables summary.
- You export each report to Excel.
- You try to match column names, add a “Company” column, and paste everything into one big sheet.
- You add formulas or pivot tables to create totals by customer and aging bucket.
By the time you finish this, the numbers are already slightly out of date. If you need the report again next week, you repeat the entire process.
It works, but it is slow and fragile.
How G-Accon makes a consolidated summary easier
G-Accon connects your QuickBooks data straight into Google Sheets. That means you can pull accounts receivable aging data from multiple entities into one place without manual exports.
You can:
- Connect each company once
- Create queries in G-Accon to fetch aged receivables summary data
- Add a company or entity field so you know where each balance belongs
- Use formulas or pivots in Google Sheets to create your consolidated view
Once you have the layout the way you like it, you do not need to rebuild it each time. You simply refresh the data. You can even schedule automatic refreshes at a set time each day or week.
The result is a live consolidated aged receivables summary that your team can open at any time. Sales, finance, and management can all look at the same numbers, instead of passing around different versions of an Excel file.
And when you need details, you can link this summary to a separate detailed report that lists each invoice. That way, you can move from “This customer owes us $50,000 in the 61–90 day bucket” to the exact invoices that make up that number.
Turning a static report into a working tool
On its own, a consolidated aged receivables summary is a useful snapshot. It tells you how much customers owe and how long they have owed it. It highlights late payments and helps you spot risk.
When you use G-Accon to build and refresh it, the report turns into a working tool. It becomes something your team can use daily to:
- Plan collection calls
- Adjust credit limits
- Support cash flow forecasts
- Keep the books reconciled and clean
In simple terms, you get a clear view of the money that should be coming in, across all your entities, and a better way to turn those numbers into action.