Client numbers are growing, revenue looks healthy at first glance, but then you look closer and spot a real issue. Half the clients from eight months ago are no longer active. Not churned in any dramatic way. They just stopped renewing, stopped replying, and slowly disappeared.
The top-line numbers hid that problem. Revenue kept going up, but your new clients were only covering up a retention issue that had been building for months.
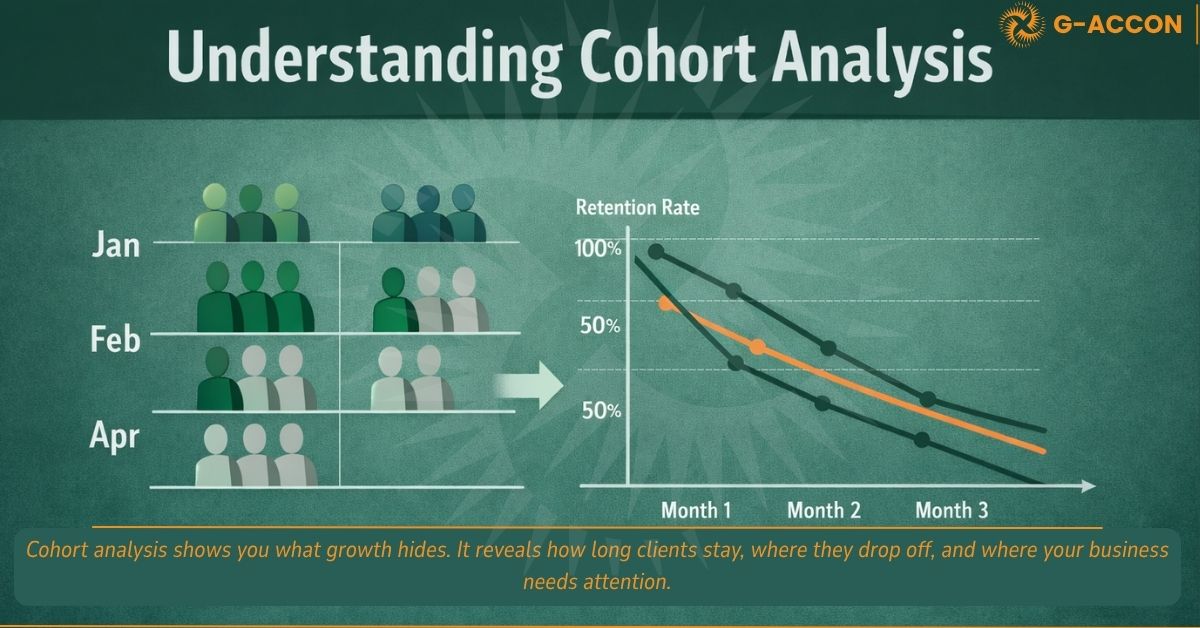
This is where cohort analysis helps. It does not replace your regular reports. It shows you something those reports often miss: not just how many clients you have today, but how many clients from a specific signup month are still with you over time.
This guide walks through building one in Google Sheets using live QuickBooks Online data. By the end, you'll have a clear picture of where your client relationships are actually holding up.
What is Cohort Analysis?
Cohort analysis is a way to group clients based on when they first signed up, then track what happens to them over time.
It answers one clear question: of the clients who joined in period X, how many were still active in period X+1, X+2, and X+3?
That is the basic idea. You are not grouping clients by what they bought, how much they spent, or where they came from. You are grouping them by when they started, then looking at how long they stayed. That is where the value comes in. Once you compare one cohort to another, patterns start to show up.
And those patterns matter. Bain & Company found that even a 5% increase in customer retention can raise profits by 25% to 95%.
For example, your January clients may still show a strong retention rate after three months, while your April clients may drop off much faster. That tells you something changed.
Maybe your pricing shifted. Maybe a key staff member left. Maybe a campaign brought in clients who were never the right fit to begin with. Cohort analysis will not tell you the exact cause. But it will show you where the problem started. That is what makes it useful. It helps you catch patterns early, so you know where to look and what questions to ask next.
Once you understand what cohort analysis shows and why it matters, the next step is getting your data ready. You cannot track retention well without clean, structured data. And once that part is in place, the rest becomes much easier to build and maintain.
Getting your data into Google Sheets
Before anything else, you need transaction-level client data in your sheet. The minimum columns required are: Customer ID (column A), Signup Date, and Purchase Date. Channel, region, and product line are optional but useful if you want to slice the data later by acquisition source or service type.
If you’re pulling this from QuickBooks Online manually, exporting reports, downloading CSVs, and reformatting date columns, you already know how that goes. It takes longer than it should, the headers never match what you expect, and within two months, nobody’s bothering to keep it current.
G-Accon connects Google Sheets directly to your QuickBooks Online account and syncs the data automatically. You connect your QBO account, select the report type, and the data lands in your sheet in the right structure. No exports, no reformatting. When you want fresh data, you click refresh.
Once your raw data is in, it should look something like this:
QBO_Cohort_Analysis
Share
G-Accon syncs this data automatically from QuickBooks Online — no manual CSV export needed
|
A |
B |
C |
D |
E |
F |
G |
H |
I |
| 1 |
Customer ID |
Customer Name |
Signup Date |
Purchase Date |
Product / Service |
Region |
Channel |
Invoice Amount ($) |
Payment Status |
| 2 |
C001 |
Apex Consulting |
10/01/2025 |
10/01/2025 |
Accounting — Monthly |
North |
Referral |
$600 |
Paid |
| 3 |
C001 |
Apex Consulting |
10/01/2025 |
15/02/2025 |
Accounting — Monthly |
North |
Referral |
$600 |
Paid |
| 4 |
C001 |
Apex Consulting |
10/01/2025 |
14/03/2025 |
Accounting — Monthly |
North |
Referral |
$600 |
Paid |
| 5 |
C002 |
Bright & Co. |
15/01/2025 |
15/01/2025 |
Payroll Processing |
South |
Paid Ads |
$400 |
Paid |
| 6 |
C002 |
Bright & Co. |
15/01/2025 |
18/02/2025 |
Payroll Processing |
South |
Paid Ads |
$400 |
Paid |
| 7 |
C003 |
CoreBridge LLC |
20/01/2025 |
20/01/2025 |
Tax Preparation |
East |
Direct |
$750 |
Paid |
| 8 |
C003 |
CoreBridge LLC |
20/01/2025 |
22/02/2025 |
Advisory Add-on |
East |
Direct |
$300 |
Paid |
| 9 |
C004 |
Delta Group |
05/02/2025 |
05/02/2025 |
Accounting — Monthly |
North |
Referral |
$550 |
Paid |
| 10 |
C004 |
Delta Group |
05/02/2025 |
07/03/2025 |
Accounting — Monthly |
North |
Referral |
$550 |
Paid |
| 11 |
C005 |
Ember Works |
18/02/2025 |
18/02/2025 |
Bookkeeping — Weekly |
West |
QBO Partner |
$400 |
Paid |
| 12 |
C006 |
Fintech Labs |
28/02/2025 |
28/02/2025 |
Tax Preparation |
South |
Paid Ads |
$700 |
Paid |
| 13 |
C006 |
Fintech Labs |
28/02/2025 |
30/03/2025 |
Advisory Add-on |
South |
Paid Ads |
$300 |
Paid |
| 14 |
C007 |
Greenfield Inc. |
04/03/2025 |
04/03/2025 |
Accounting — Monthly |
North |
Referral |
$600 |
Paid |
| 15 |
C007 |
Greenfield Inc. |
04/03/2025 |
08/04/2025 |
Accounting — Monthly |
North |
Referral |
$500 |
Paid |
| 16 |
C008 |
Harbor Analytics |
20/03/2025 |
20/03/2025 |
Payroll Processing |
South |
Paid Ads |
$400 |
Paid |
| 17 |
C009 |
Irongate LLC |
01/04/2025 |
01/04/2025 |
Bookkeeping — Weekly |
East |
Direct |
$350 |
Paid |
| 18 |
C010 |
Jetstream Co. |
12/04/2025 |
12/04/2025 |
Tax Preparation |
West |
QBO Partner |
$800 |
Paid |
| 19 |
C010 |
Jetstream Co. |
12/04/2025 |
15/05/2025 |
Advisory Add-on |
West |
QBO Partner |
$300 |
Pending |
| 20 |
C011 |
Kestrel Media |
22/04/2025 |
22/04/2025 |
Accounting — Monthly |
North |
Referral |
$500 |
Paid |
| … |
More rows below |
COLUMN GUIDE
| Column |
Description |
| Customer ID |
Unique identifier per client, pulled directly from QBO. Used as the key field in COUNTIFS formulas later. |
| Customer Name |
Client name as it appears in QuickBooks Online. Useful for manual QA and readability. |
| Signup Date |
The date this client was first created in QBO. This is the basis for the Cohort Month column added in Step 1. |
| Purchase Date |
Date of each individual invoice or transaction. Used to calculate Transaction Month and Period Number. |
| Product / Service |
QBO product or service line item. Optional for basic cohort analysis — essential if you want to filter by service type. |
| Region |
Geographic segment. Useful for segment-based cohort slicing in later analysis. |
| Channel |
Acquisition source (Referral, Paid Ads, Direct, QBO Partner). Key variable for comparing cohort quality by channel. |
| Invoice Amount |
Revenue per transaction. Used if you want to extend this analysis from customer retention to revenue retention. |
| Payment Status |
Paid or Pending. Filter to Paid-only rows before building your cohort table to avoid counting unpaid invoices as active. |
Filter to Payment Status = Paid before building your cohort table.
Before moving forward, check two things. First, make sure your Signup Date and Purchase Date columns are formatted as actual dates, not text that looks like dates. Real dates align right in their cells. Text dates align left and will cause your formulas to fail.
Second, and this one matters more than it sounds- check for customers with multiple different signup dates across their rows. If C001 shows January 10th in one row and February 5th in another, those rows land in different cohorts, which quietly corrupts your retention numbers. Add a helper column, “Clean Signup Date,” and use:
This enforces one signup date per Customer ID. Every downstream formula should reference this clean column, not the raw one.
How To Perform Cohort Analysis in Excel
Step 1: Group each client by their signup month
Cohort analysis works at the month level. A client who signed up on January 4th and a client who signed up on January 29th belong to the same cohort; you’re asking the same question about both of them.
In column J, add a header: Cohort Month. In J2, use this formula:
=DATE(YEAR(I2),MONTH(I2),1) |
This takes the cleaned signup date and resets it to the first day of that month. Using the Clean Signup Date column, here is what makes the MINIFS cleanup carry through.
|
Important: Do not wrap this in a TEXT() function to format it as “Jan 2025”. That converts your date into a plain text string, and later, when you try to calculate months between dates, the formula will break. Keep column J as a real date and format it visually:
Format → Number → Custom date and time → MMM YYYY.
|
Drag the formula down through all your rows.
QBO_Cohort_Analysis
Share
J2
fx=DATE(YEAR(I2),MONTH(I2),1)
Group each client by signup month, keep as a real date, format column as MMM YYYY. Do NOT use TEXT()
|
A |
B |
C |
D |
E |
F |
G |
H |
I |
J |
| 1 |
Customer ID |
Customer Name |
Signup Date |
Purchase Date |
Product / Service |
Region |
Channel |
Invoice Amt |
Clean Signup Date |
Cohort Month |
| 2 |
C001 |
Apex Consulting |
10/01/2025 |
10/01/2025 |
Accounting — Monthly |
North |
Referral |
$600 |
10/01/2025 |
Jan 2025 |
| 3 |
C001 |
Apex Consulting |
10/01/2025 |
15/02/2025 |
Accounting — Monthly |
North |
Referral |
$600 |
10/01/2025 |
Jan 2025 |
| 4 |
C001 |
Apex Consulting |
10/01/2025 |
14/03/2025 |
Accounting — Monthly |
North |
Referral |
$600 |
10/01/2025 |
Jan 2025 |
| 5 |
C002 |
Bright & Co. |
15/01/2025 |
15/01/2025 |
Payroll Processing |
South |
Paid Ads |
$400 |
15/01/2025 |
Jan 2025 |
| 6 |
C002 |
Bright & Co. |
15/01/2025 |
18/02/2025 |
Payroll Processing |
South |
Paid Ads |
$400 |
15/01/2025 |
Jan 2025 |
| 7 |
C003 |
CoreBridge LLC |
20/01/2025 |
20/01/2025 |
Tax Preparation |
East |
Direct |
$750 |
20/01/2025 |
Jan 2025 |
| 8 |
C004 |
Delta Group |
05/02/2025 |
05/02/2025 |
Accounting — Monthly |
North |
Referral |
$550 |
05/02/2025 |
Feb 2025 |
| 9 |
C005 |
Ember Works |
18/02/2025 |
18/02/2025 |
Bookkeeping — Weekly |
West |
QBO Partner |
$400 |
18/02/2025 |
Feb 2025 |
| 10 |
C006 |
Fintech Labs |
28/02/2025 |
28/02/2025 |
Tax Preparation |
South |
Paid Ads |
$700 |
28/02/2025 |
Feb 2025 |
| 11 |
C007 |
Greenfield Inc. |
04/03/2025 |
04/03/2025 |
Accounting — Monthly |
North |
Referral |
$600 |
04/03/2025 |
Mar 2025 |
| … |
More rows below |
Format column J as MMM YYYY via Format → Number → Custom date and time
Every client now has a cohort label. Clients with multiple purchases appear in multiple rows but carry the same Cohort Month, because it’s tied to their signup date, not their purchase date.
Step 2: Calculate how far along each client is
The second column tracks each client’s position in their lifecycle at the time of each transaction. You’re not just asking “did they come back?” but “how many months after joining did they come back?”
In column K, add: Transaction Month. In K2:
=DATE(YEAR(C2),MONTH(C2),1) |
Apply the same MMM YYYY custom date format — keep it as a real date, just display it as text. Then, in column L, add: Period Number. In L2:
=IF(C2<I2,"",DATEDIF(J2,K2,"m")) |
The IF check prevents negative period numbers from data entry errors. Period 0 = signup month. Period 1 = one month later. Period 2 = two months later.
QBO_Cohort_Analysis
Share
L2
fx=IF(C2<I2,"",DATEDIF(J2,K2,"m"))
Period 0 = signup month • Period 1 = one month later • Period 2 = two months later
|
A |
B |
C |
··· |
I |
J |
K |
L |
| 1 |
Customer ID |
Customer Name |
Purchase Date |
··· |
Clean Signup Date |
Cohort Month |
Transaction Month |
Period Number |
| 2 |
C001 |
Apex Consulting |
10/01/2025 |
··· |
10/01/2025 |
Jan 2025 |
Jan 2025 |
0 |
| 3 |
C001 |
Apex Consulting |
15/02/2025 |
··· |
10/01/2025 |
Jan 2025 |
Feb 2025 |
1 |
| 4 |
C001 |
Apex Consulting |
14/03/2025 |
··· |
10/01/2025 |
Jan 2025 |
Mar 2025 |
2 |
| 5 |
C002 |
Bright & Co. |
15/01/2025 |
··· |
15/01/2025 |
Jan 2025 |
Jan 2025 |
0 |
| 6 |
C002 |
Bright & Co. |
18/02/2025 |
··· |
15/01/2025 |
Jan 2025 |
Feb 2025 |
1 |
| 7 |
C003 |
CoreBridge LLC |
20/01/2025 |
··· |
20/01/2025 |
Jan 2025 |
Jan 2025 |
0 |
| 8 |
C004 |
Delta Group |
05/02/2025 |
··· |
05/02/2025 |
Feb 2025 |
Feb 2025 |
0 |
| 9 |
C004 |
Delta Group |
07/03/2025 |
··· |
05/02/2025 |
Feb 2025 |
Mar 2025 |
1 |
| 10 |
C005 |
Ember Works |
18/02/2025 |
··· |
18/02/2025 |
Feb 2025 |
Feb 2025 |
0 |
| 11 |
C007 |
Greenfield Inc. |
04/03/2025 |
··· |
04/03/2025 |
Mar 2025 |
Mar 2025 |
0 |
| 12 |
C007 |
Greenfield Inc. |
08/04/2025 |
··· |
04/03/2025 |
Mar 2025 |
Apr 2025 |
1 |
| … |
More rows below |
DATEDIF does not appear in autocomplete — type it manually. It works correctly.
DATEDIF doesn’t appear in Sheets’ autocomplete suggestions; it’s a legacy function that Google never surfaced in the UI. Type it manually, and it works perfectly.
Step 3: Build the cohort count table
Create a new sheet; call it “Cohort Pivot.” Cohort months run down the rows. Period numbers run across the columns (0, 1, 2, 3…).
Each cell answers: how many unique clients from this cohort were active in this period? A client with three transactions in the same month should count once, not three times. In B2 (January cohort, Period 0):
=COUNTA(UNIQUE(FILTER(Sheet1!$A:$A,(Sheet1!$J:$J=$A2)*(Sheet1!$L:$L=B$1)))) |
FILTER pulls the matching Customer IDs, UNIQUE deduplicates them, COUNTA counts what’s left. Write it once in B2, drag across all period columns, and down all cohort rows.
|
On scale: COUNTA(UNIQUE(FILTER())) works well up to a few thousand rows. On very large datasets, it can slow Sheets down. If you hit lag, consider pulling a pre-aggregated summary from G-Accon instead.
|
QBO_Cohort_Analysis
Share
B2
fx=COUNTA(UNIQUE(FILTER(Sheet1!$A:$A,(Sheet1!$J:$J=$A2)*(Sheet1!$L:$L=B$1))))
UNIQUE() deduplicates, each client counts once per period, regardless of how many transactions they made
|
A |
B |
C |
D |
E |
F |
| 1 |
Cohort Month |
Period 0 |
Period 1 |
Period 2 |
Period 3 |
Period 4 |
| 2 |
Jan 2025 |
7 |
4 |
3 |
2 |
1 |
| 3 |
Feb 2025 |
6 |
3 |
2 |
1 |
— |
| 4 |
Mar 2025 |
5 |
3 |
2 |
— |
— |
| 5 |
Apr 2025 |
4 |
2 |
— |
— |
— |
| … |
More rows below |
%
Author
Andrew Robert ShassetzAndrew is a content writer at G-Accon, where he helps make complex accounting tech and SaaS topics easier to understand. He works with software teams, consultants, and finance professionals to create content that’s clear, practical, and actually useful to the people reading it.
With a background in journalism, Andrew knows how to ask the right questions and turn expert knowledge into straightforward writing that supports real decision-making.