|
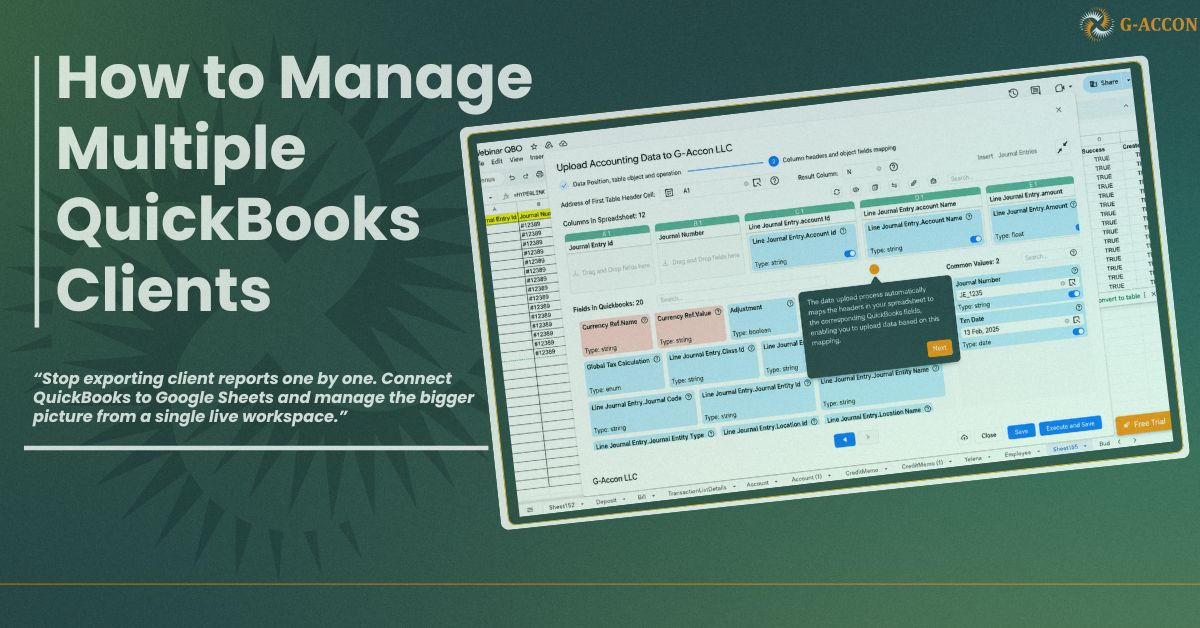
If you’ve ever searched for How to Manage Multiple QuickBooks Clients without turning month-end into a spreadsheet cleanup project, this is the problem you’re trying to solve. Once you run an accounting firm or manage books for several businesses, the work starts to pile up fast. Every client has a separate QuickBooks Online company. Every company needs reports. Every file comes with its own chart of accounts, naming habits, reporting structure, and deadlines waiting at the end of the month. Then comes the harder part. You need consolidated financials, side-by-side client reporting, or intercompany eliminations. So you export data from one QuickBooks file, then another, paste everything into a master sheet, and hope the account names match. When they don’t, you spend more time fixing the report than using it. There’s a cleaner way to handle it. And it works directly inside Google Sheets.
The Problem With Managing Clients One Export at a TimeEvery QuickBooks export is a dead snapshot. The moment you download that CSV, it starts going stale. If a client's bookkeeper posts a late entry or a payment clears that afternoon, your spreadsheet doesn't reflect it. You're working off old numbers, and you might not even realize it. Multiply that across ten or fifteen clients, and you've got a real mess. Not just the staleness, the sheer volume of manual work. Downloading, reformatting, relabeling columns, merging files. Firms lose hours to this every single week, and none of it is actual accounting work. It's data plumbing. The firms that have moved past this aren't using some expensive enterprise platform. Most of them are still in Google Sheets. They've just connected those sheets directly to QuickBooks. Connecting QuickBooks to Google Sheets With a Live LinkG-Accon is a Google Sheets add-on that plugs straight into QuickBooks Online. Once it's installed, you access everything from the Extensions menu, no separate app, no browser tab switching, no desktop software.
From that menu, you can pull formatted financial reports, download raw transaction data, or generate consolidated reports across multiple QBO companies. Everything lands in your Google Sheet and stays connected to the source. When the data changes in QuickBooks, your sheet picks it up. That last part is what changes the workflow. You're not exporting and pasting anymore. You're setting up a template once and letting it refresh on its own. Building Consolidated Reports Without the Copy-Paste MarathonHere's the scenario. You manage four QBO entities and need a consolidated Profit and Loss statement with intercompany eliminations applied. Normally, that's an afternoon of work, maybe longer if the account structures don't match cleanly across entities. In G-Accon, you open the consolidated report builder. Select your companies. Pick Profit and Loss with Intercompany Eliminations as the report type. Set your date range, choose how many comparison periods you want, define your elimination set, and apply any account groupings.
Hit execute, and the consolidated P&L will generate directly in your sheet. All four entities, monthly columns, intercompany transactions already stripped out, and accounts grouped according to your rules.
No copying between workbooks. No VLOOKUP chains trying to match account names across files. No manual elimination entries that you have to reverse and redo next month. The template saves, so next month you just refresh it. Making the Output Look Like It Came From Your FirmOne underrated detail: you can style these reports before they generate. Font, colors, header formatting, borders. You set it in the Report Style Settings, and it applies every time the report runs.
That might sound cosmetic, but it matters when you're sending financials to clients or presenting to a board. Nobody wants to receive a report that looks like a raw data dump. And nobody wants to spend twenty minutes manually formatting one either. Going Deeper: Pulling Transaction-Level DataSometimes the summary report isn't enough. You need the line items, every invoice for the quarter, a full journal entry audit, or a breakout of expenses by class. G-Accon's data pull feature lets you select exactly which QBO table you want (invoices, bills, payments, accounts, over fifty options) and pick the specific fields you need. Date range, filters, sort order, all set before the data even touches your sheet.
What makes this different from a standard QBO export is precision. You're not getting a giant file with forty columns you don't need. You pick ten fields, they show up in the order you chose, already filtered and sorted. The cleanup step just disappears. Pushing Data Back Into QuickBooks From Your SheetMost integrations are one-way. You can pull data out, but if you need to create or update records, you're back in QuickBooks doing it by hand. G-Accon works in both directions. You can build journal entries, invoices, or any other record type directly in your spreadsheet and push them into QBO. Select your rows, pick the QuickBooks table, choose your operation, insert, modify, or delete, and G-Accon maps your spreadsheet columns to the matching QBO fields automatically.
For firms handling data cleanups, client migrations, or bulk adjustments, this is where the real time savings stack up. Fifty journal entries in a spreadsheet, uploaded in one batch instead of being entered one at a time through the QBO interface. Every upload also logs results at the row level, what went through, what didn't, and why. So you're not left guessing if something failed silently. Setting It to Run Without YouOnce your templates are built, your consolidated P&L, your invoice pulls, and your expense breakouts, you can schedule them to auto-refresh. Daily before your team logs in, weekly before a Monday meeting, whatever cadence fits the client. You create workflows through the Edit Templates panel, assign a schedule, and the data updates on its own. Your Monday morning dashboard is already current before you've opened your laptop.
Turning Live Data Into a Client-Facing DashboardEverything above feeds into the final piece, dashboards. G-Accon includes pre-built KPI templates that pull from your connected QBO data and lay it out in a Watch List format. Total income, gross profit, expenses, net income, and margin percentages across twelve months, with charts tracking the trends underneath.
Connect it to a client's entity, turn on auto-refresh, and you've got a live dashboard you can share with them directly. For firms pitching advisory services alongside compliance work, that's a tangible deliverable, not just "we did your taxes" but "here's where your business stands this month, updated automatically." How to Manage Multiple QuickBooks Clients: Getting Started With G-AcconG-Accon runs as a Google Sheets add-on. You can install it from the Google Workspace Marketplace and connect your first QuickBooks company in a few minutes. There's a free trial if you want to test the consolidated reporting and two-way sync before committing. If you're running a firm and still exporting CSVs from each client individually, this workflow replaces everything.
|