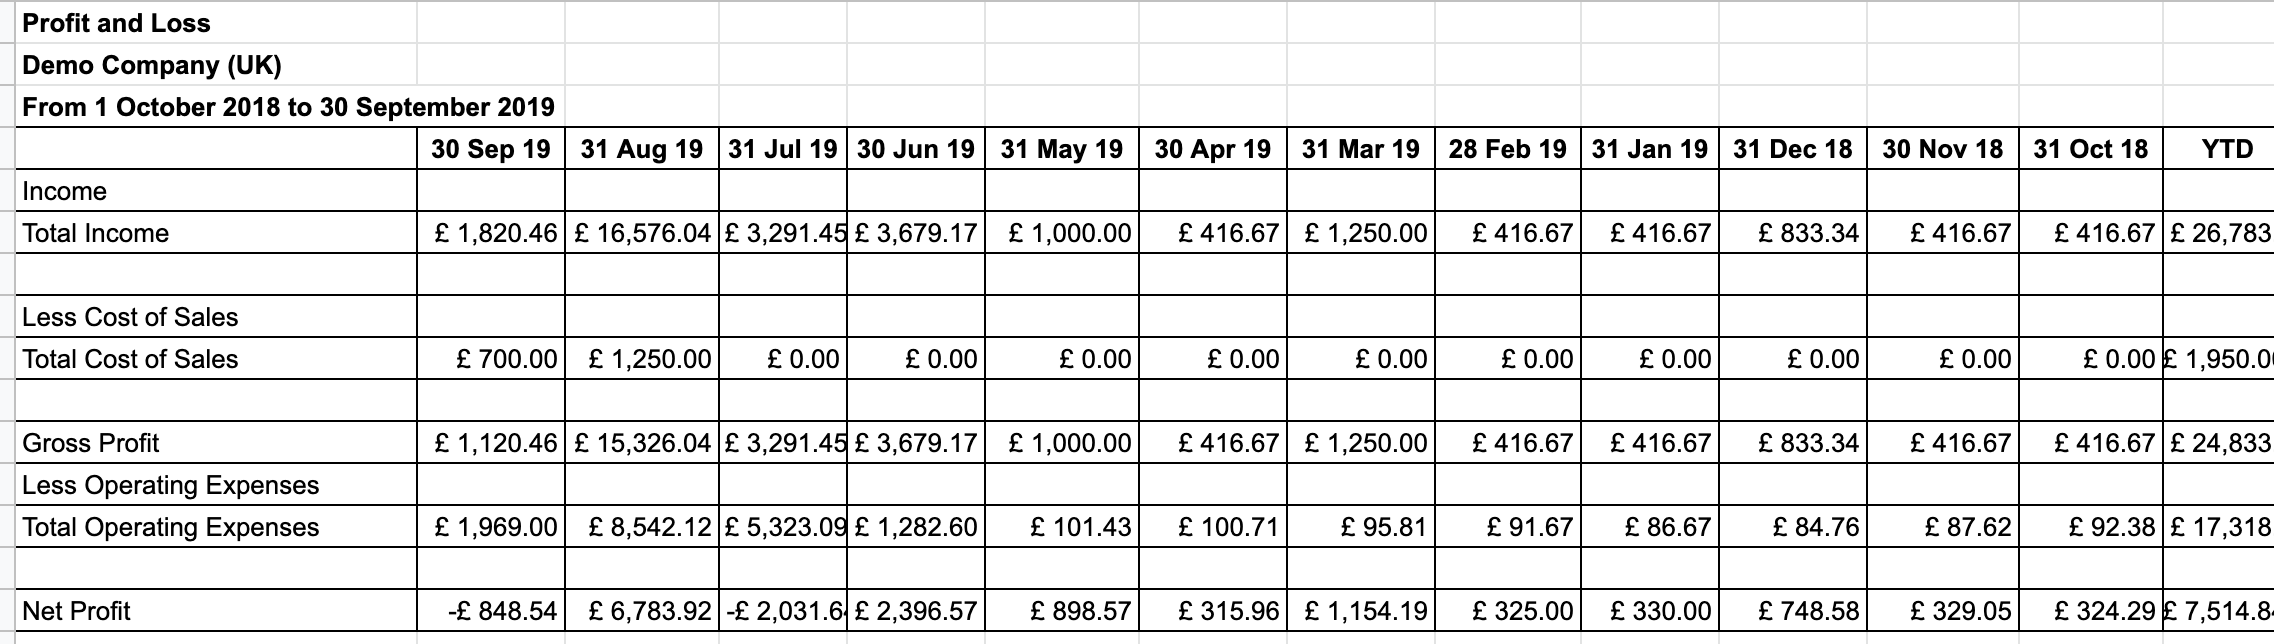
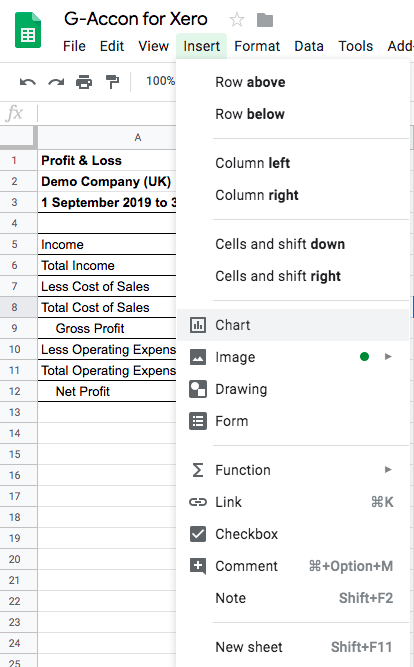
In order to generate Google Chart based on the accounting data created by using G-Accon tool, first you need to select an existing financial report. In the below example, Profit and Loss report has been selected.
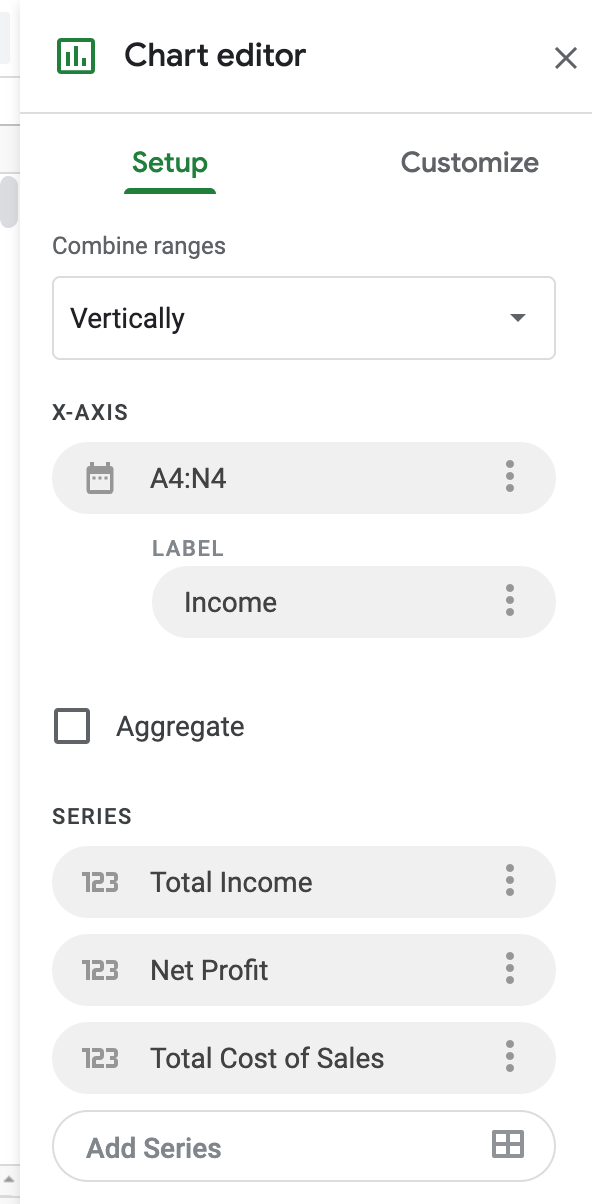
Then you need to select your data, and choose the Chart option under the Insert menu option of the main Google Sheet menu.
After you select Chart, the chart will be generated within your google spreadsheet.
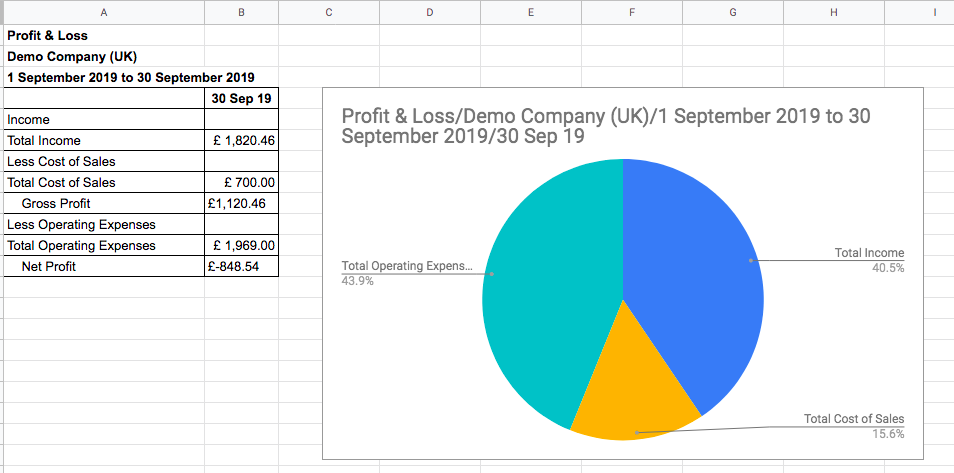
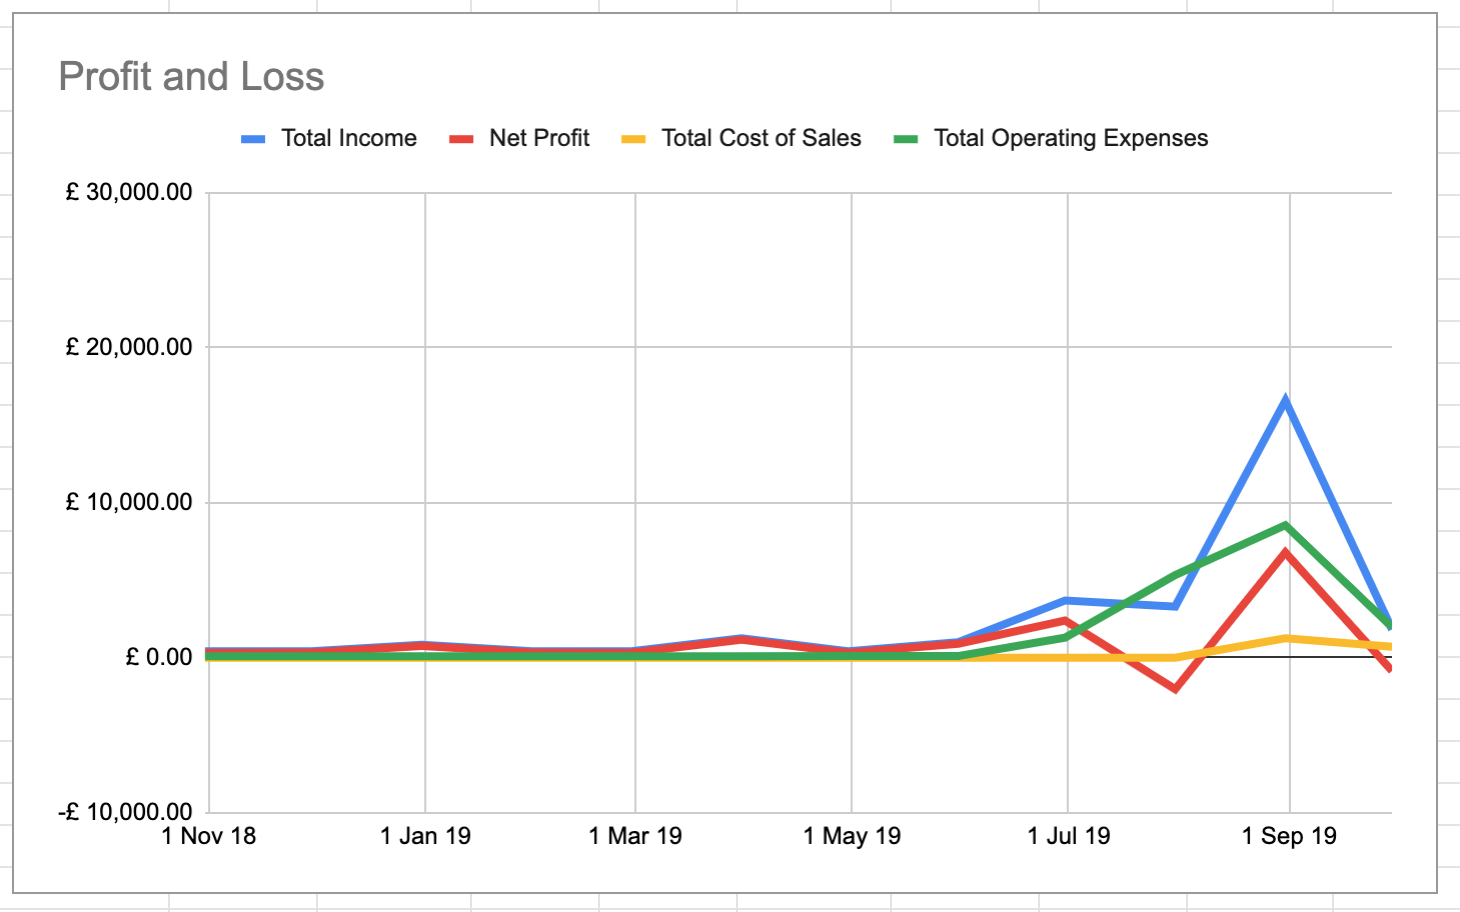
When your data manually refreshed or got updated by using G-Accon automated/scheduled download process, your chart will be automatically refreshed showing the new values.
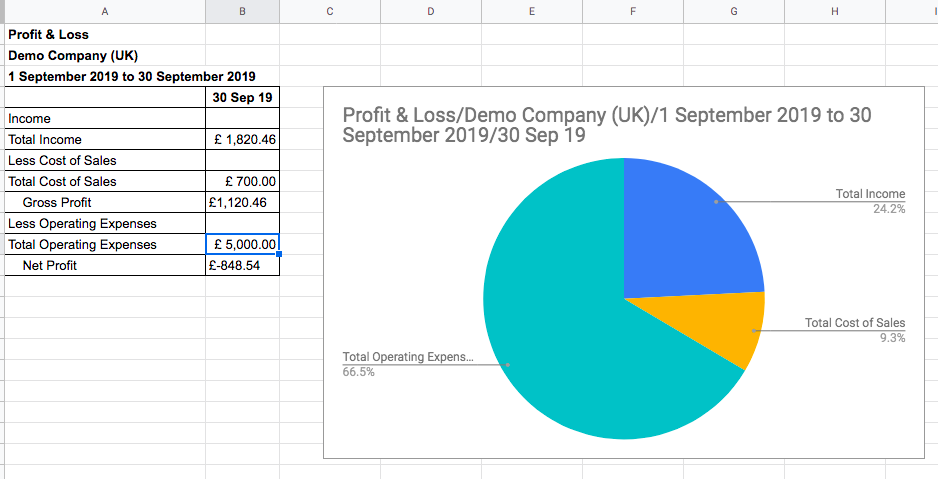
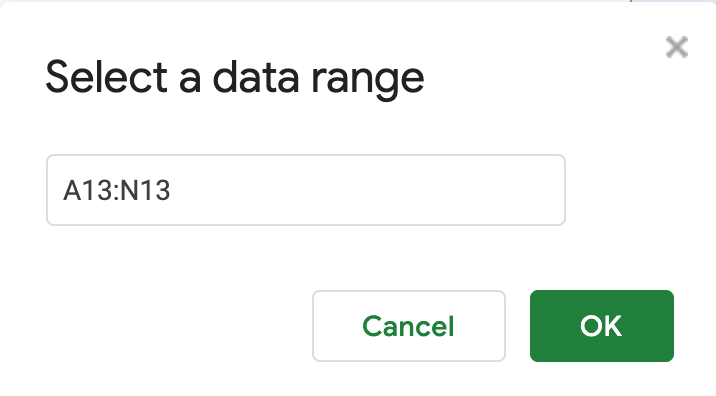
Here is the another Profit and Loss example, where you can add desired row(s) to your chart, modify chart type, color, and style.