Your Complete Guide to G-Accon

G-Accon Help Center

Explore step-by-step guides, troubleshooting tips, and best practices to make the most of G-Accon. Whether you're setting up integrations, automating reports, or optimizing workflows, our help center has everything you need to succeed.
Wiki Menu

Formatted Reports

Formatted Reports and how to design them

SECTIONS IN THIS ARTICLE

What are Formatted Reports
How to generate Formatted Reports
How to design reports using Report Style feature
List of Formatted Reports

Check out our interactive tutorial below, or keep reading to learn more.


What are Formatted Reports

The "Formatted Reports" deliver a comprehensive overview of your company's financial well-being and performance. These reports present a top-level perspective on your business's crucial financial indicators, empowering you to make informed decisions.

These reports come with pre-designed templates that include default styles, fonts, and layouts. However, G-Accon users have the flexibility to easily customize these templates to align with their unique requirements.
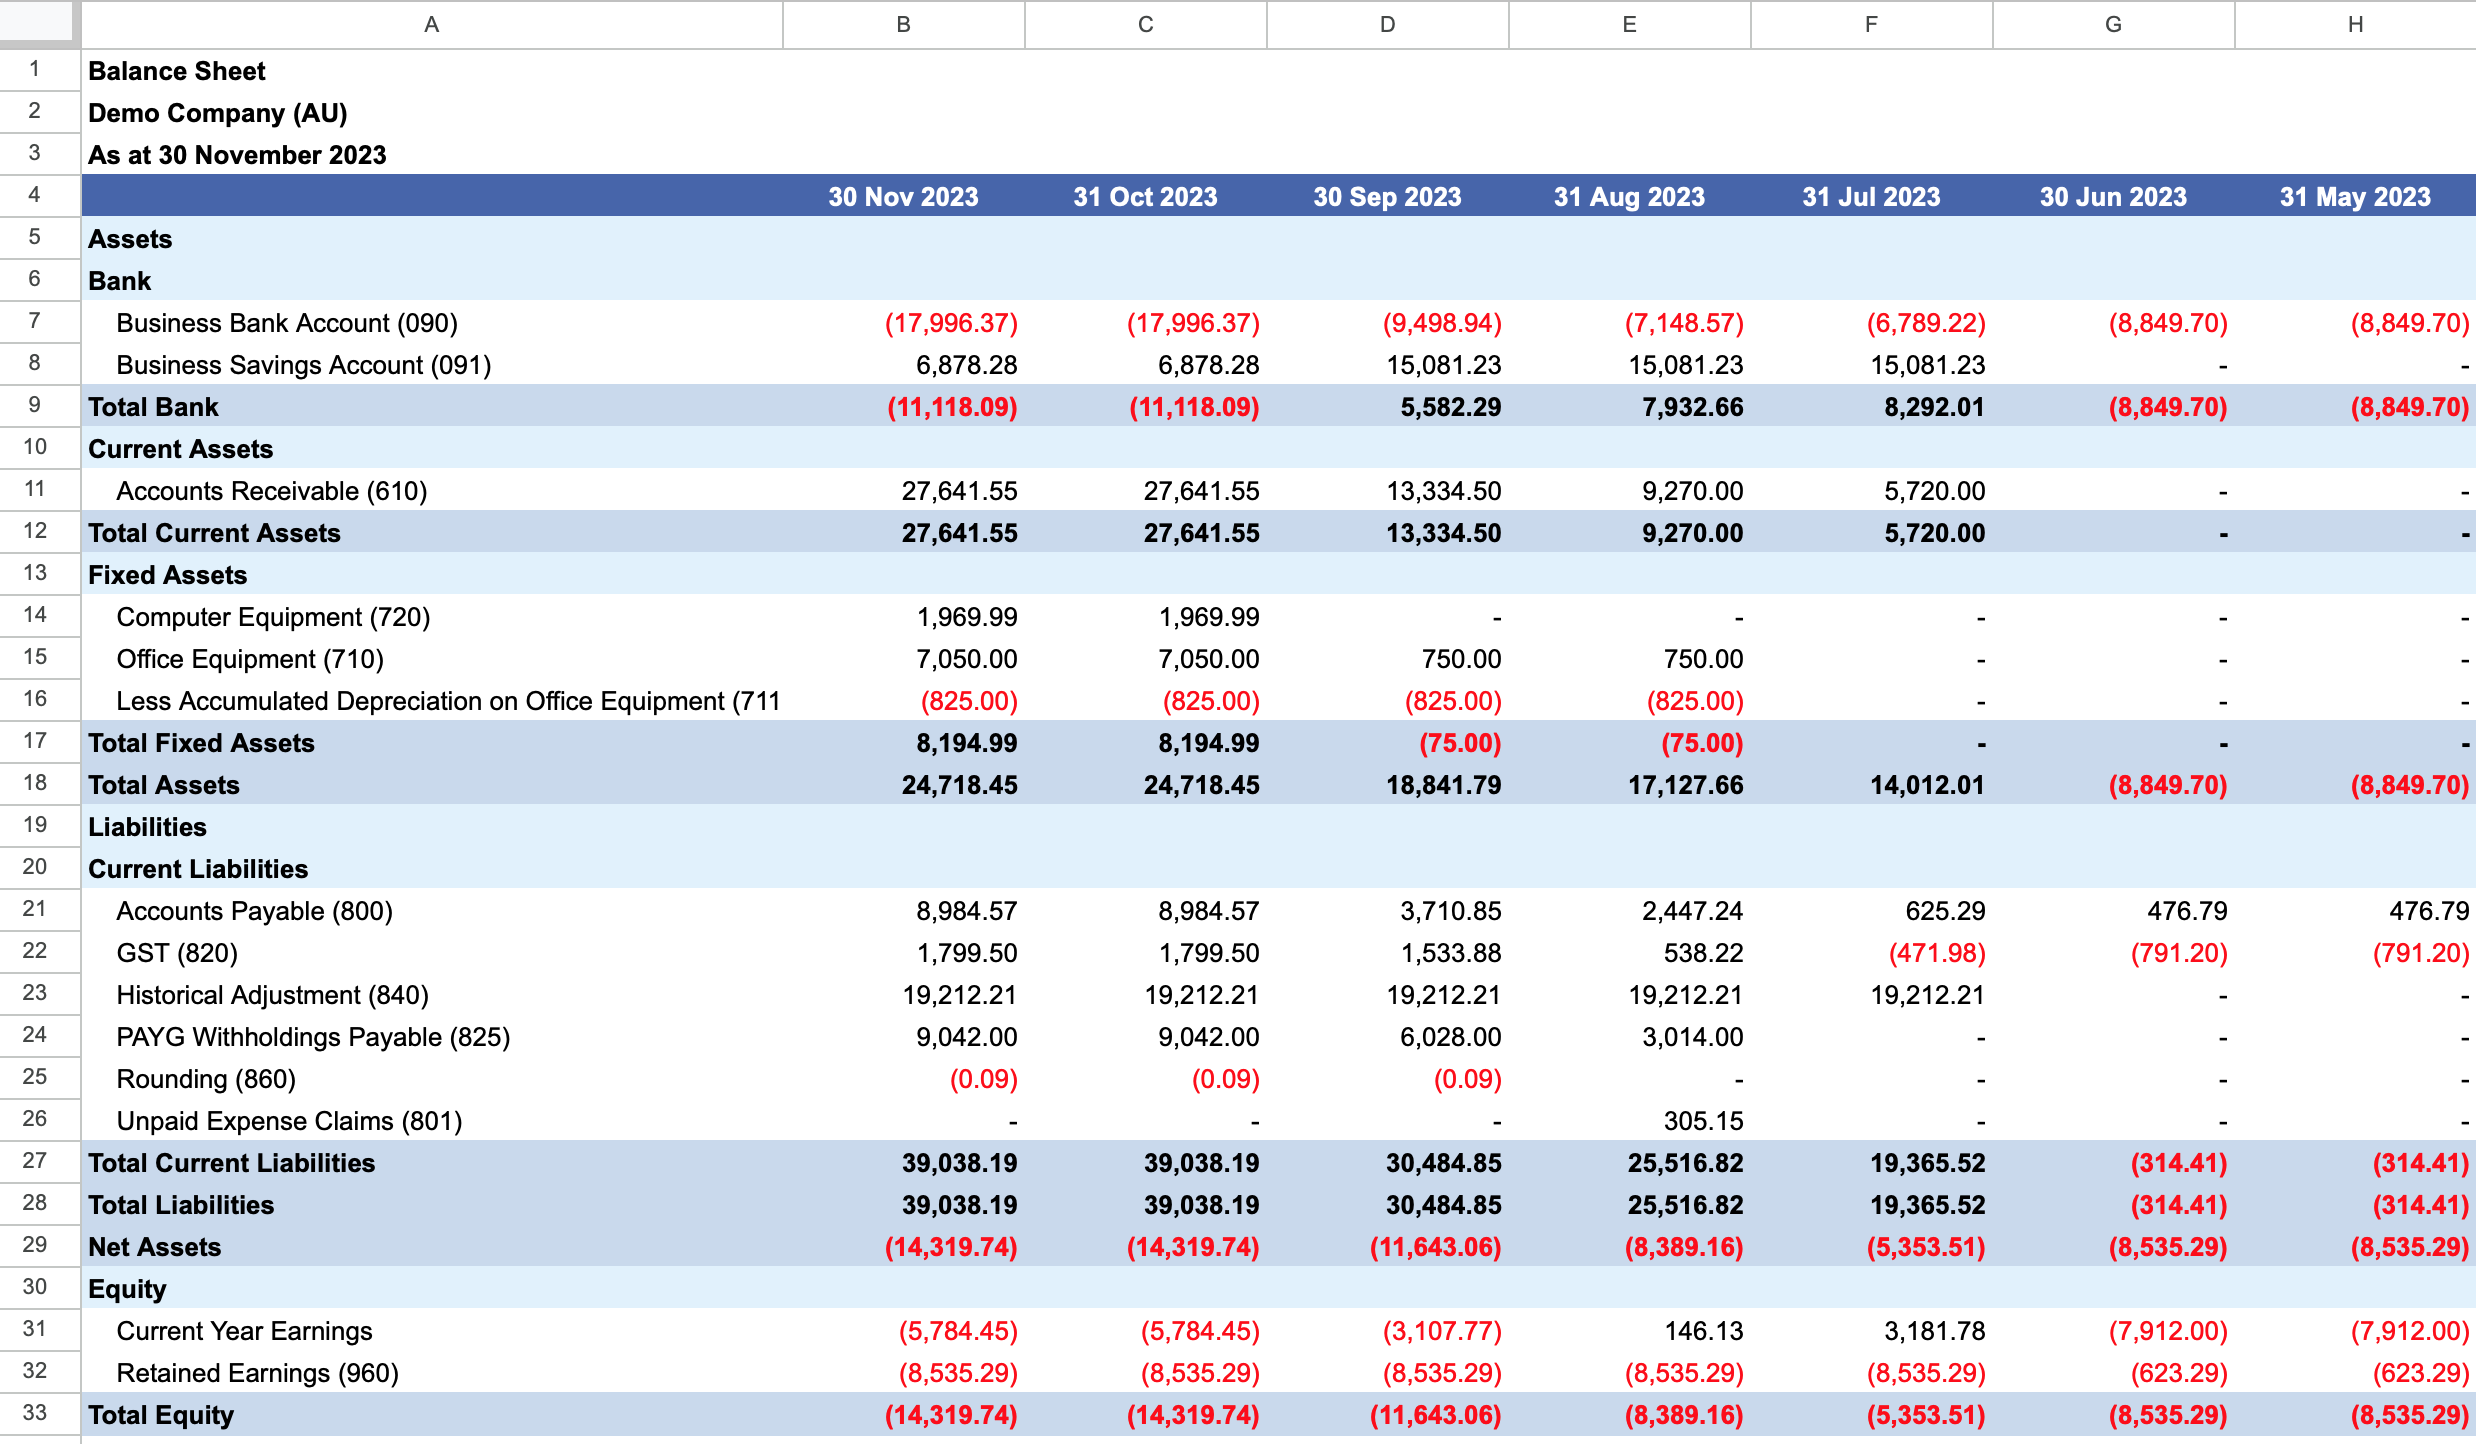
Formatted Reports pre-designed templates showing default styles, fonts, and layout options

Formatted Reports includes information related to revenue, expenses, profitability, and cash flow. You can customize these reports to focus on specific time periods or aspects of your business, giving you valuable insights into how your company is performing.

Formatted Reports provided by G-Accon is a essential tool for assessing your business's overall financial well-being and identifying areas for improvement.

Here is the list of available reports within the "Formatted Reports" category:
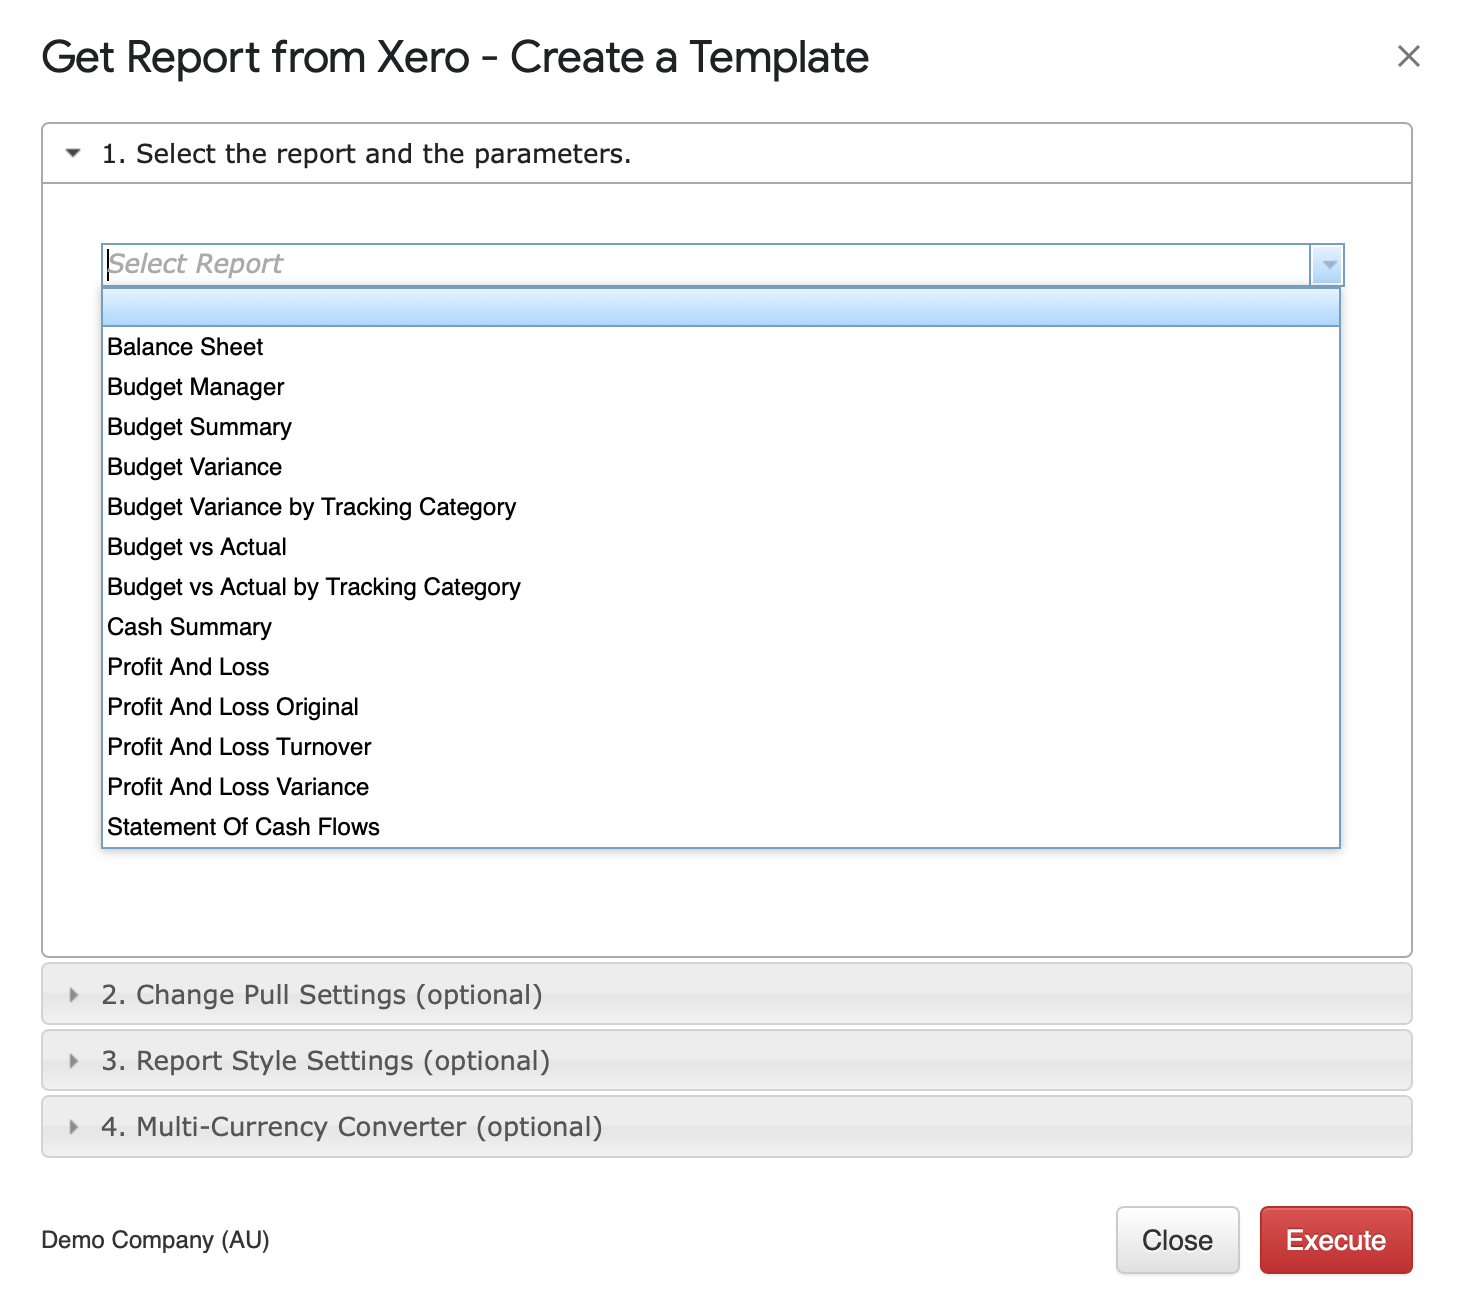
  1. Balance Sheet
  2. Budget Manager
  3. Budget Summary
  4. Budget Variance
  5. Budget Variance by Tracking Category
  6. Budget vs Actual
  7. Budget vs Actual by Tracking Category
  8. Cash Summary
  9. Profit and Loss
  10. Profit and Loss Originals
  11. Profit and Loss Turnover
  12. Profit and Loss Variance
  13. Statement of Cash Flows
List of available Formatted Reports including Balance Sheet, Budget Manager, and Profit and Loss variations

How to generate Formatted Reports

Generating Reports:

  • Ensure you are signed inย  into G-Accon for QuickBooks.
  • Go to the menu and select "Extensions"
  • Choose "G-Accon for Xero".
  • Click on "Get Accounting Data/Reports"
  • Select "Formatted Reports"

There are multiple business accounting reports you can select from the drop down box which allow you to create reusable templates for later on usage.

For example, you select the Balance Sheet option from the drop-down menu. G-Accon for Xero provides the ability to set up the Date Range for your data manually or you can refresh your data dynamically.
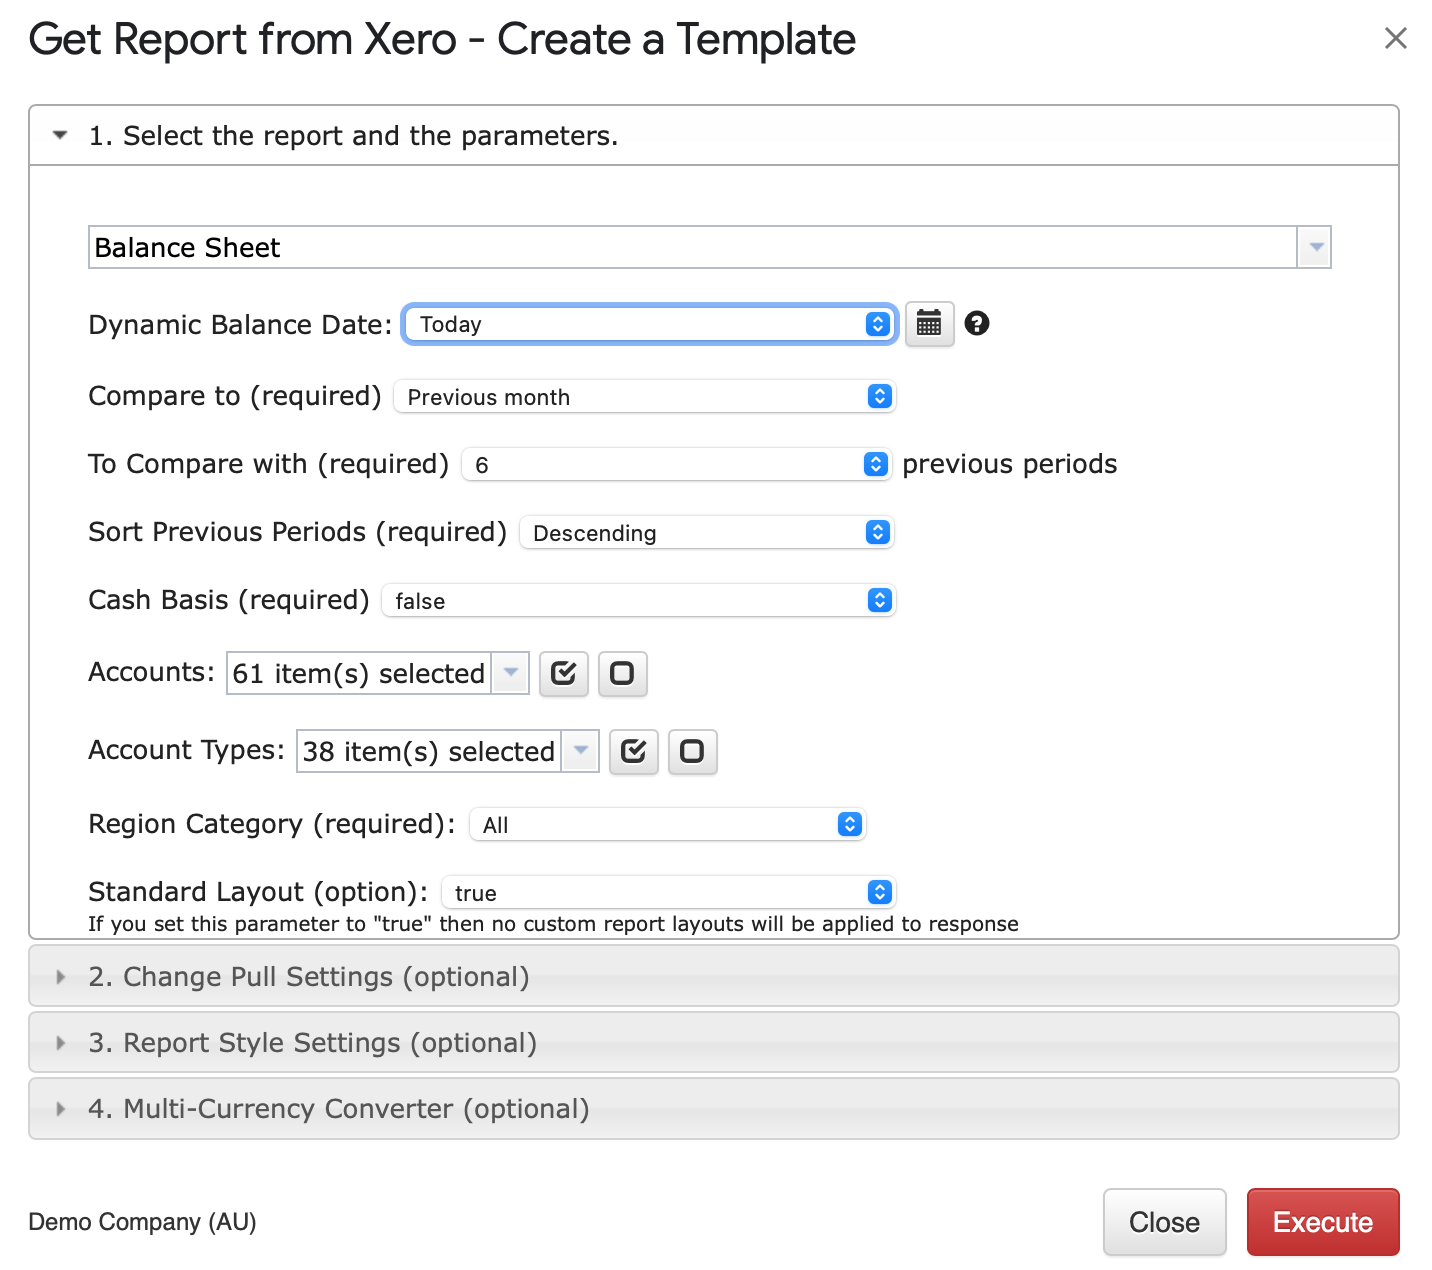
Balance Sheet report selected from the Formatted Reports drop-down menu with Date Range options

Select parameters

There are required and optional attributes for the Balance Sheet report.

Dynamic Date: The report data will be calculated based on pre-populated values like This Month, This Quarter, This Year, Last Month, etc.
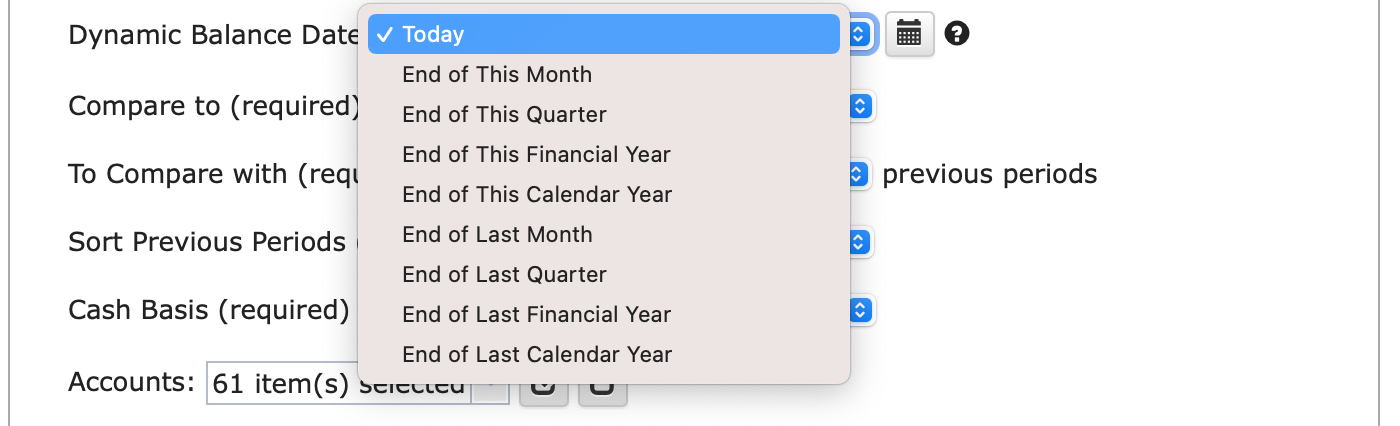
Dynamic Date dropdown showing pre-populated period options like This Month and This Quarter

Static Date Range: Define specific start and end dates.

Static Date Range fields for entering specific start and end dates

Custom Date Range: Utilize cell references in your Google Sheet to set custom dates.

Custom Date Range cell reference icons for linking report dates to Google Sheets cells

Required Attributes

Make selections for required attributes:

  • To compare with a specified number of periods (###).
  • Choose the desired Accounting Type.
  • Select relevant Accounts, Cash Basis, Tracking Categories

To compare with ( ### ) periods

Accounting Types (Accrual/Cash)

Accounts

CHANGE PULL SETTINGS (OPTIONAL FEATURES)

Customize report behavior with these optional features:
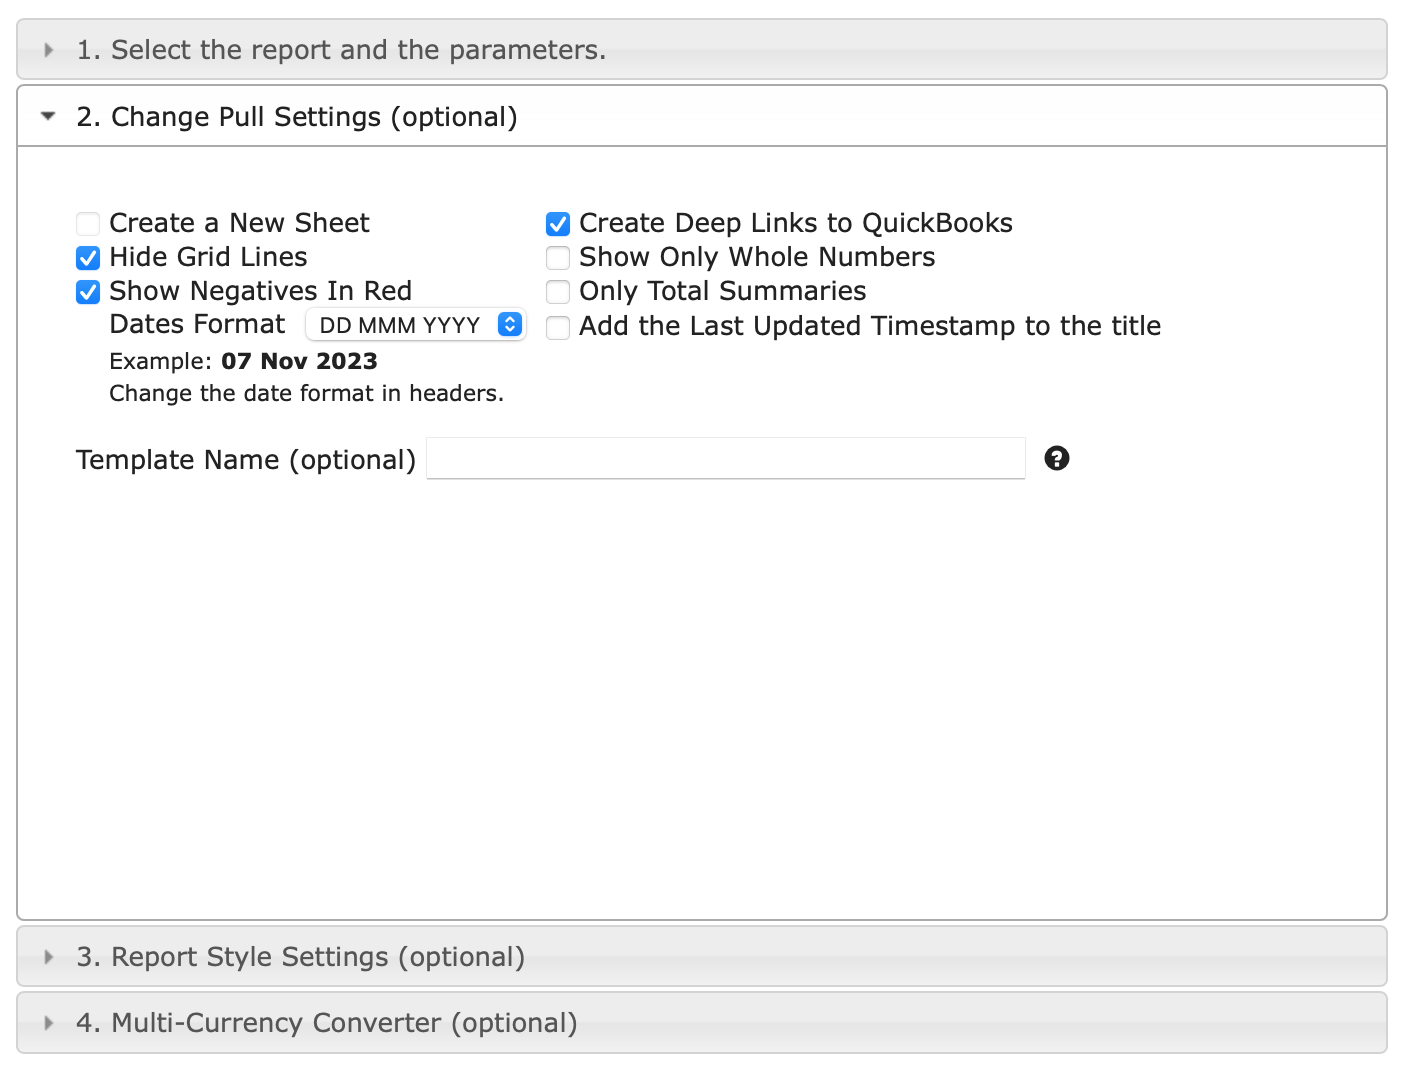
  • Create a New Google Sheet: Generate the report in a new tab or worksheet.
  • Hide Grid Lines: Conceal grid lines in your worksheet for a cleaner look.
  • Show Negatives in Red: Negative values will be displayed in red in your Google Sheet report.
  • Create Deep Links to QuickBooks: Generate links to QuickBooks for viewing specific items.
  • Show Only Whole Numbers: Display only whole numbers in the report.
  • Only Total Summaries: Show report summaries without detailed information.
  • Add the Last Updated Timestamp to the Title: Include a "Last Update" field showing the latest data refresh date and time.
Change Pull Settings panel showing optional formatting features like Hide Grid Lines and Show Negatives in Red

You have the option to specify the template's name in the "Template Name" field, such as "Balance Sheets for Organization ABC."

How to design Formatted Reports using Report Style feature

Report style SETTINGS (OPTIONAL FEATURES)

Customize the style of your report using Report Style Settings:
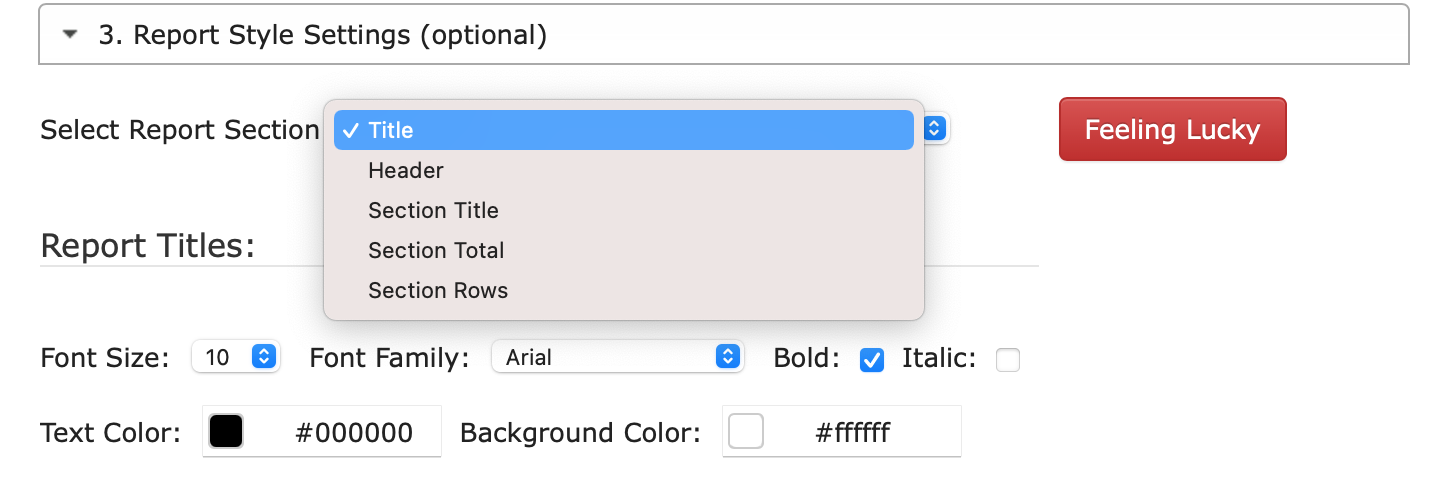
  • Configure various aspects such as title, header style, colors, background, and fonts.
  • Select specific report sections (title, headers, sub-section totals) and customize font styles, sizes, colors, and borders.

Report Style Settings panel for customizing title, header style, colors, and fonts

Customize your report to create a unique and distinctive presentation.
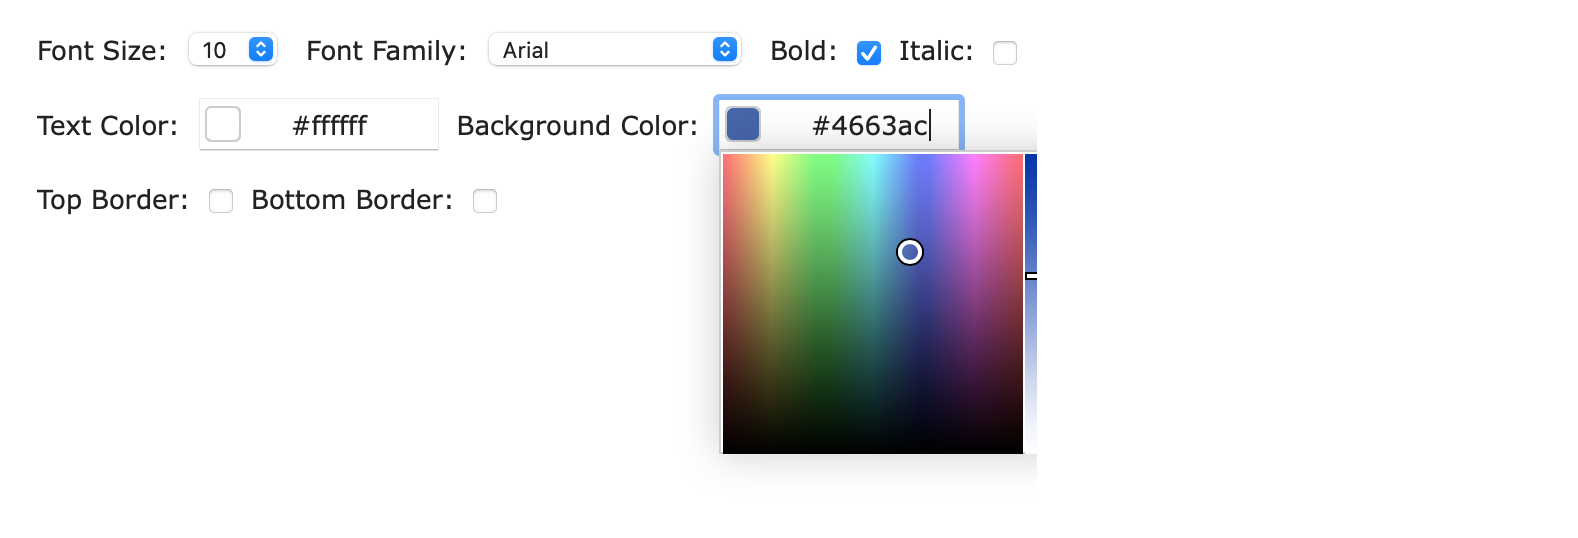
Customized Balance Sheet report showing a distinctive style presentation

Here's the revised design of the Balance Sheet report:
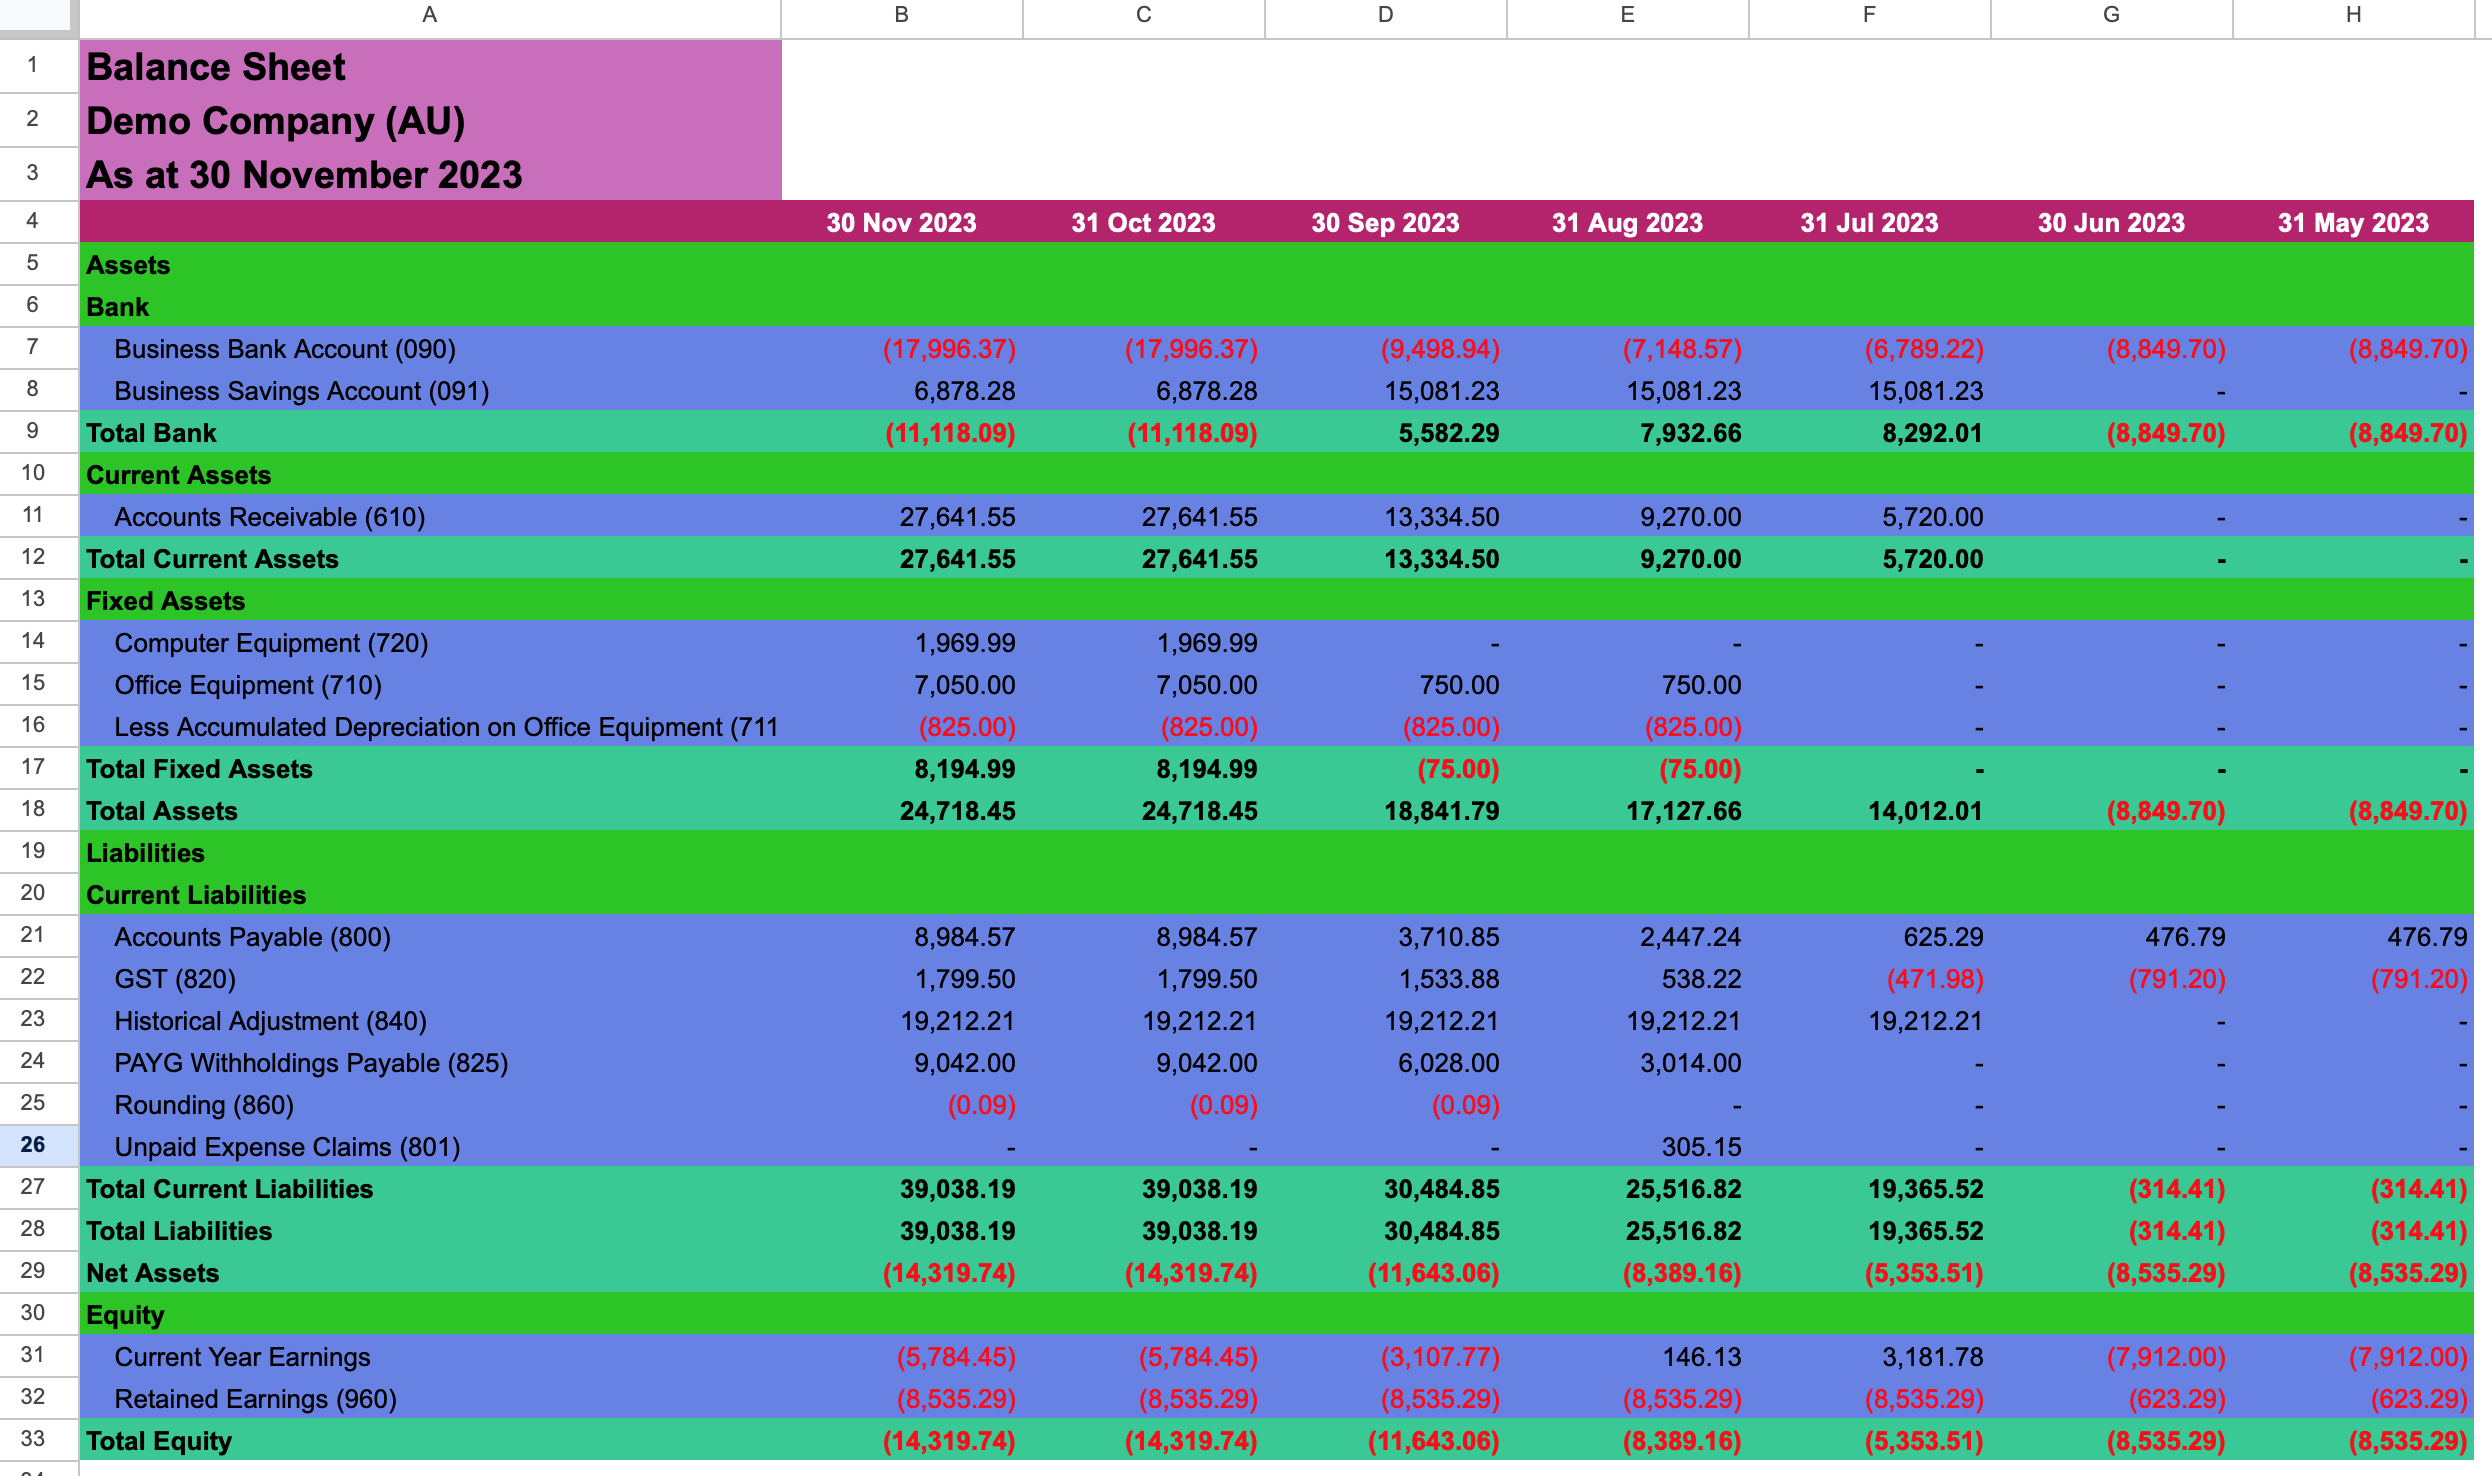
Revised design of the Balance Sheet report with custom styling applied
MULTI-CURRENCY CONVERTER (OPTIONAL FEATURES)

If you need to generate the report in a specific currency, follow these steps:

  • Choose the report currency (e.g., "EUR").

    Decide how to get exchange rates:
    • Use Latest Rates: The report uses the latest available exchange rate.
    • Use Custom Rates: Set your own exchange rates for a specific date or create a separate tab with multiple custom rates.
    • Use Custom Rates for Periods: Set custom rates for specific periods in the same way.

Using Latest Rates: If you select "Use Latest Rates" and click "Execute," the report uses the latest exchange rate from the provider each time you refresh the report.

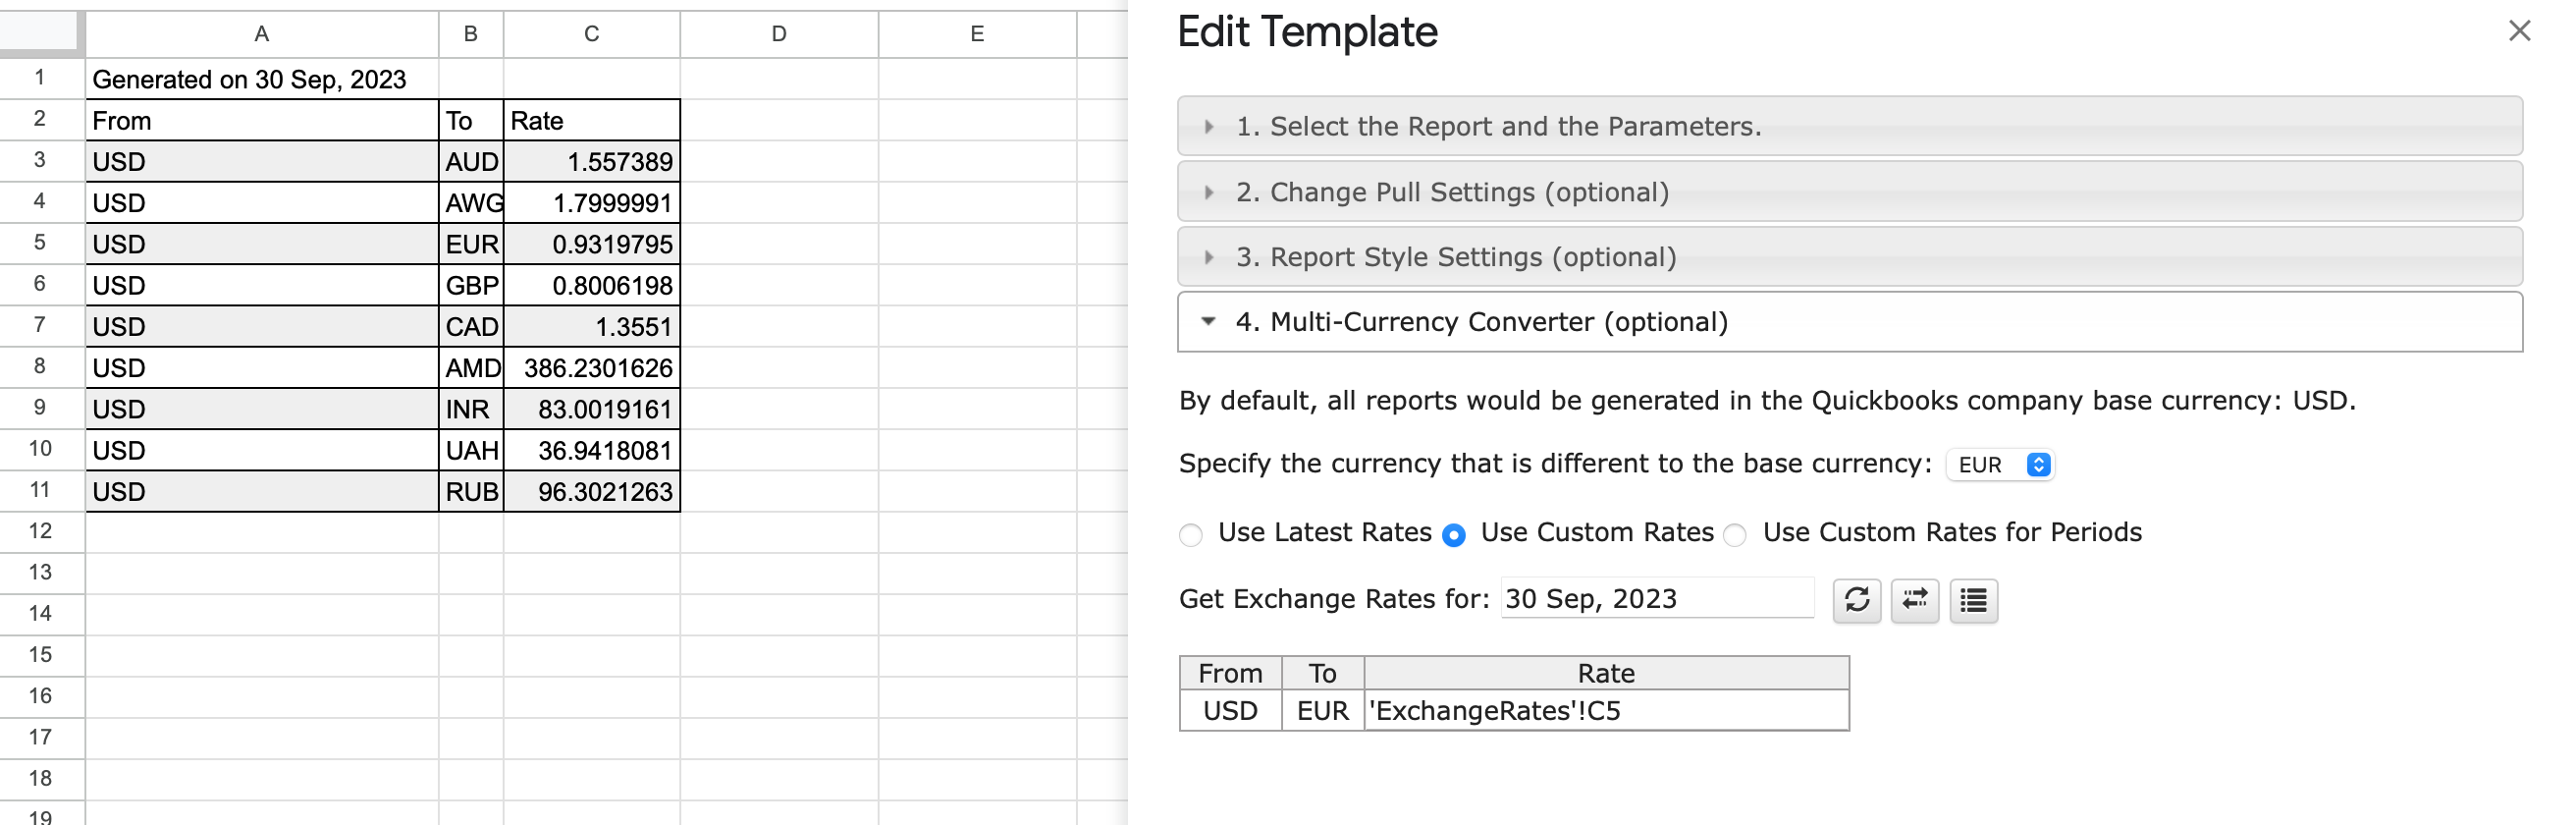
Using Custom Rates: Choose "Use Custom Rates," specify a date, and decide whether to get rates directly or create a separate tab with custom rates. This feature lets you manually adjust exchange rates for the report.
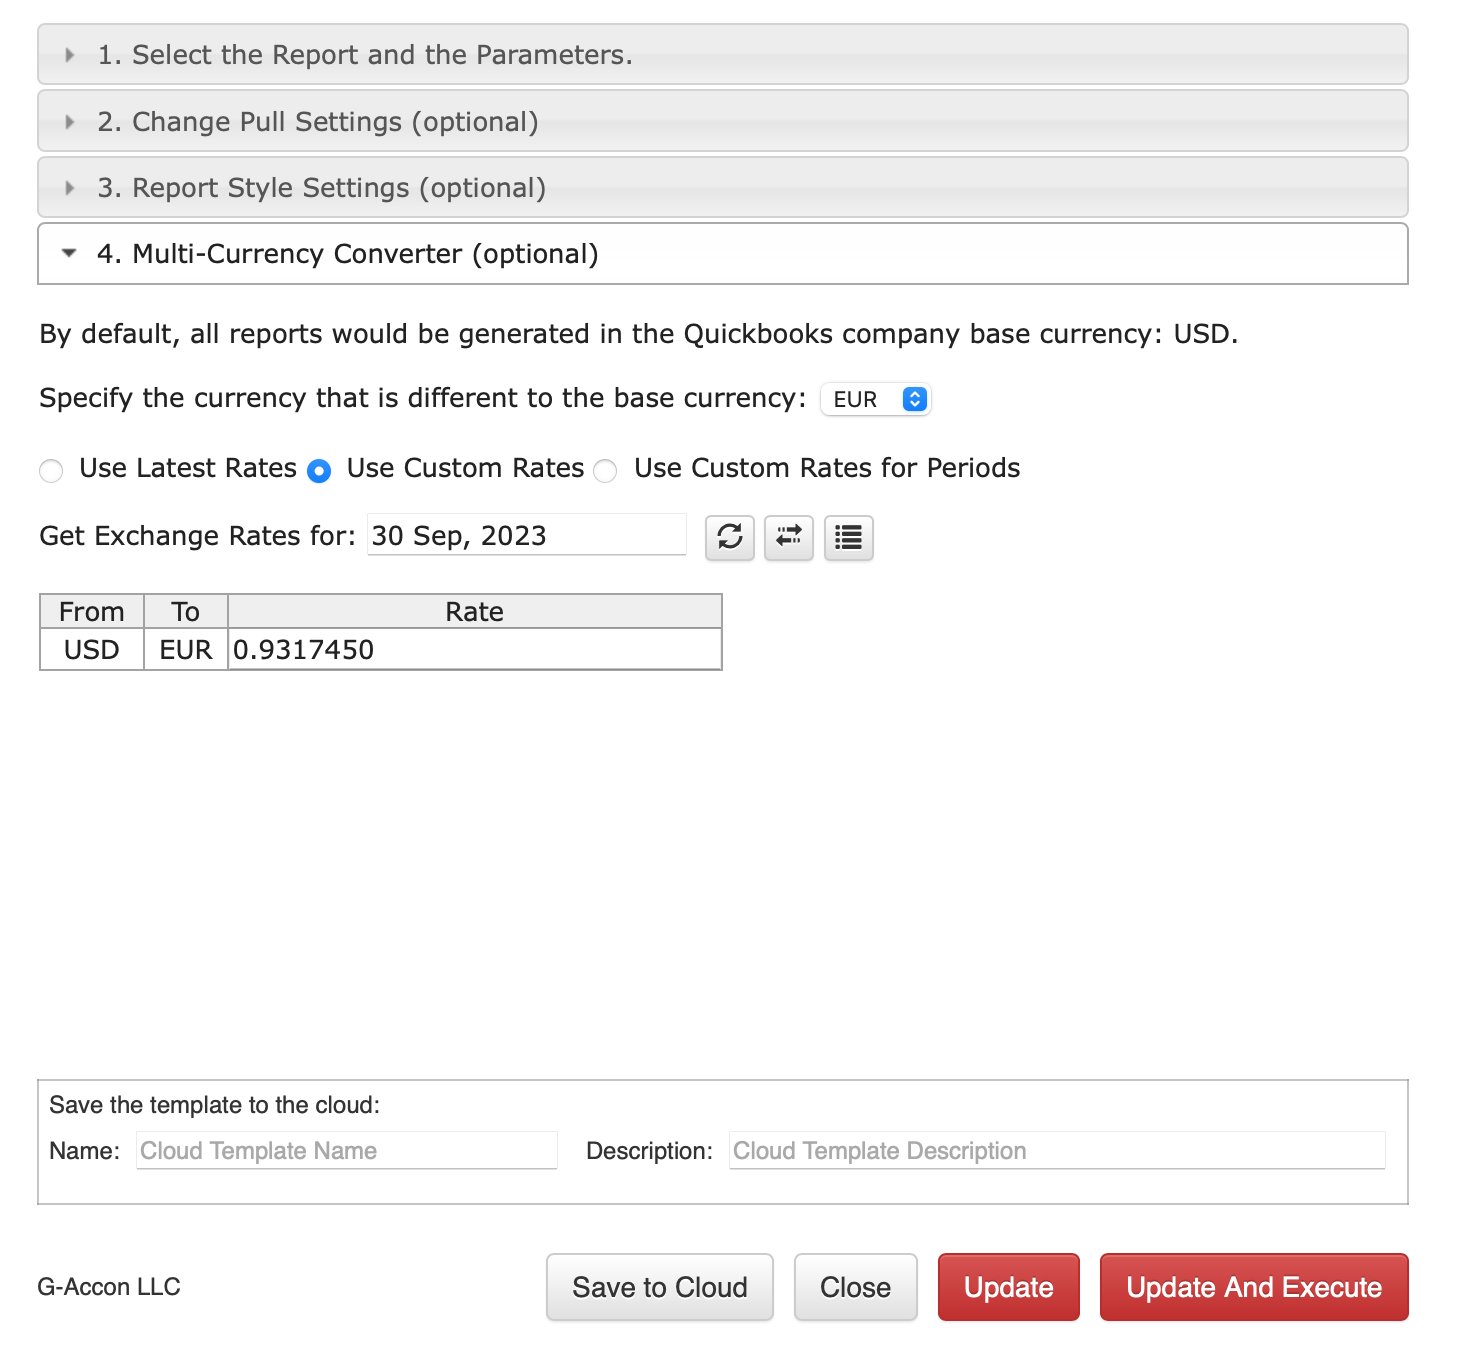
Multi-Currency Converter panel with Use Custom Rates option selected
Custom exchange rate entry field for a specific report date

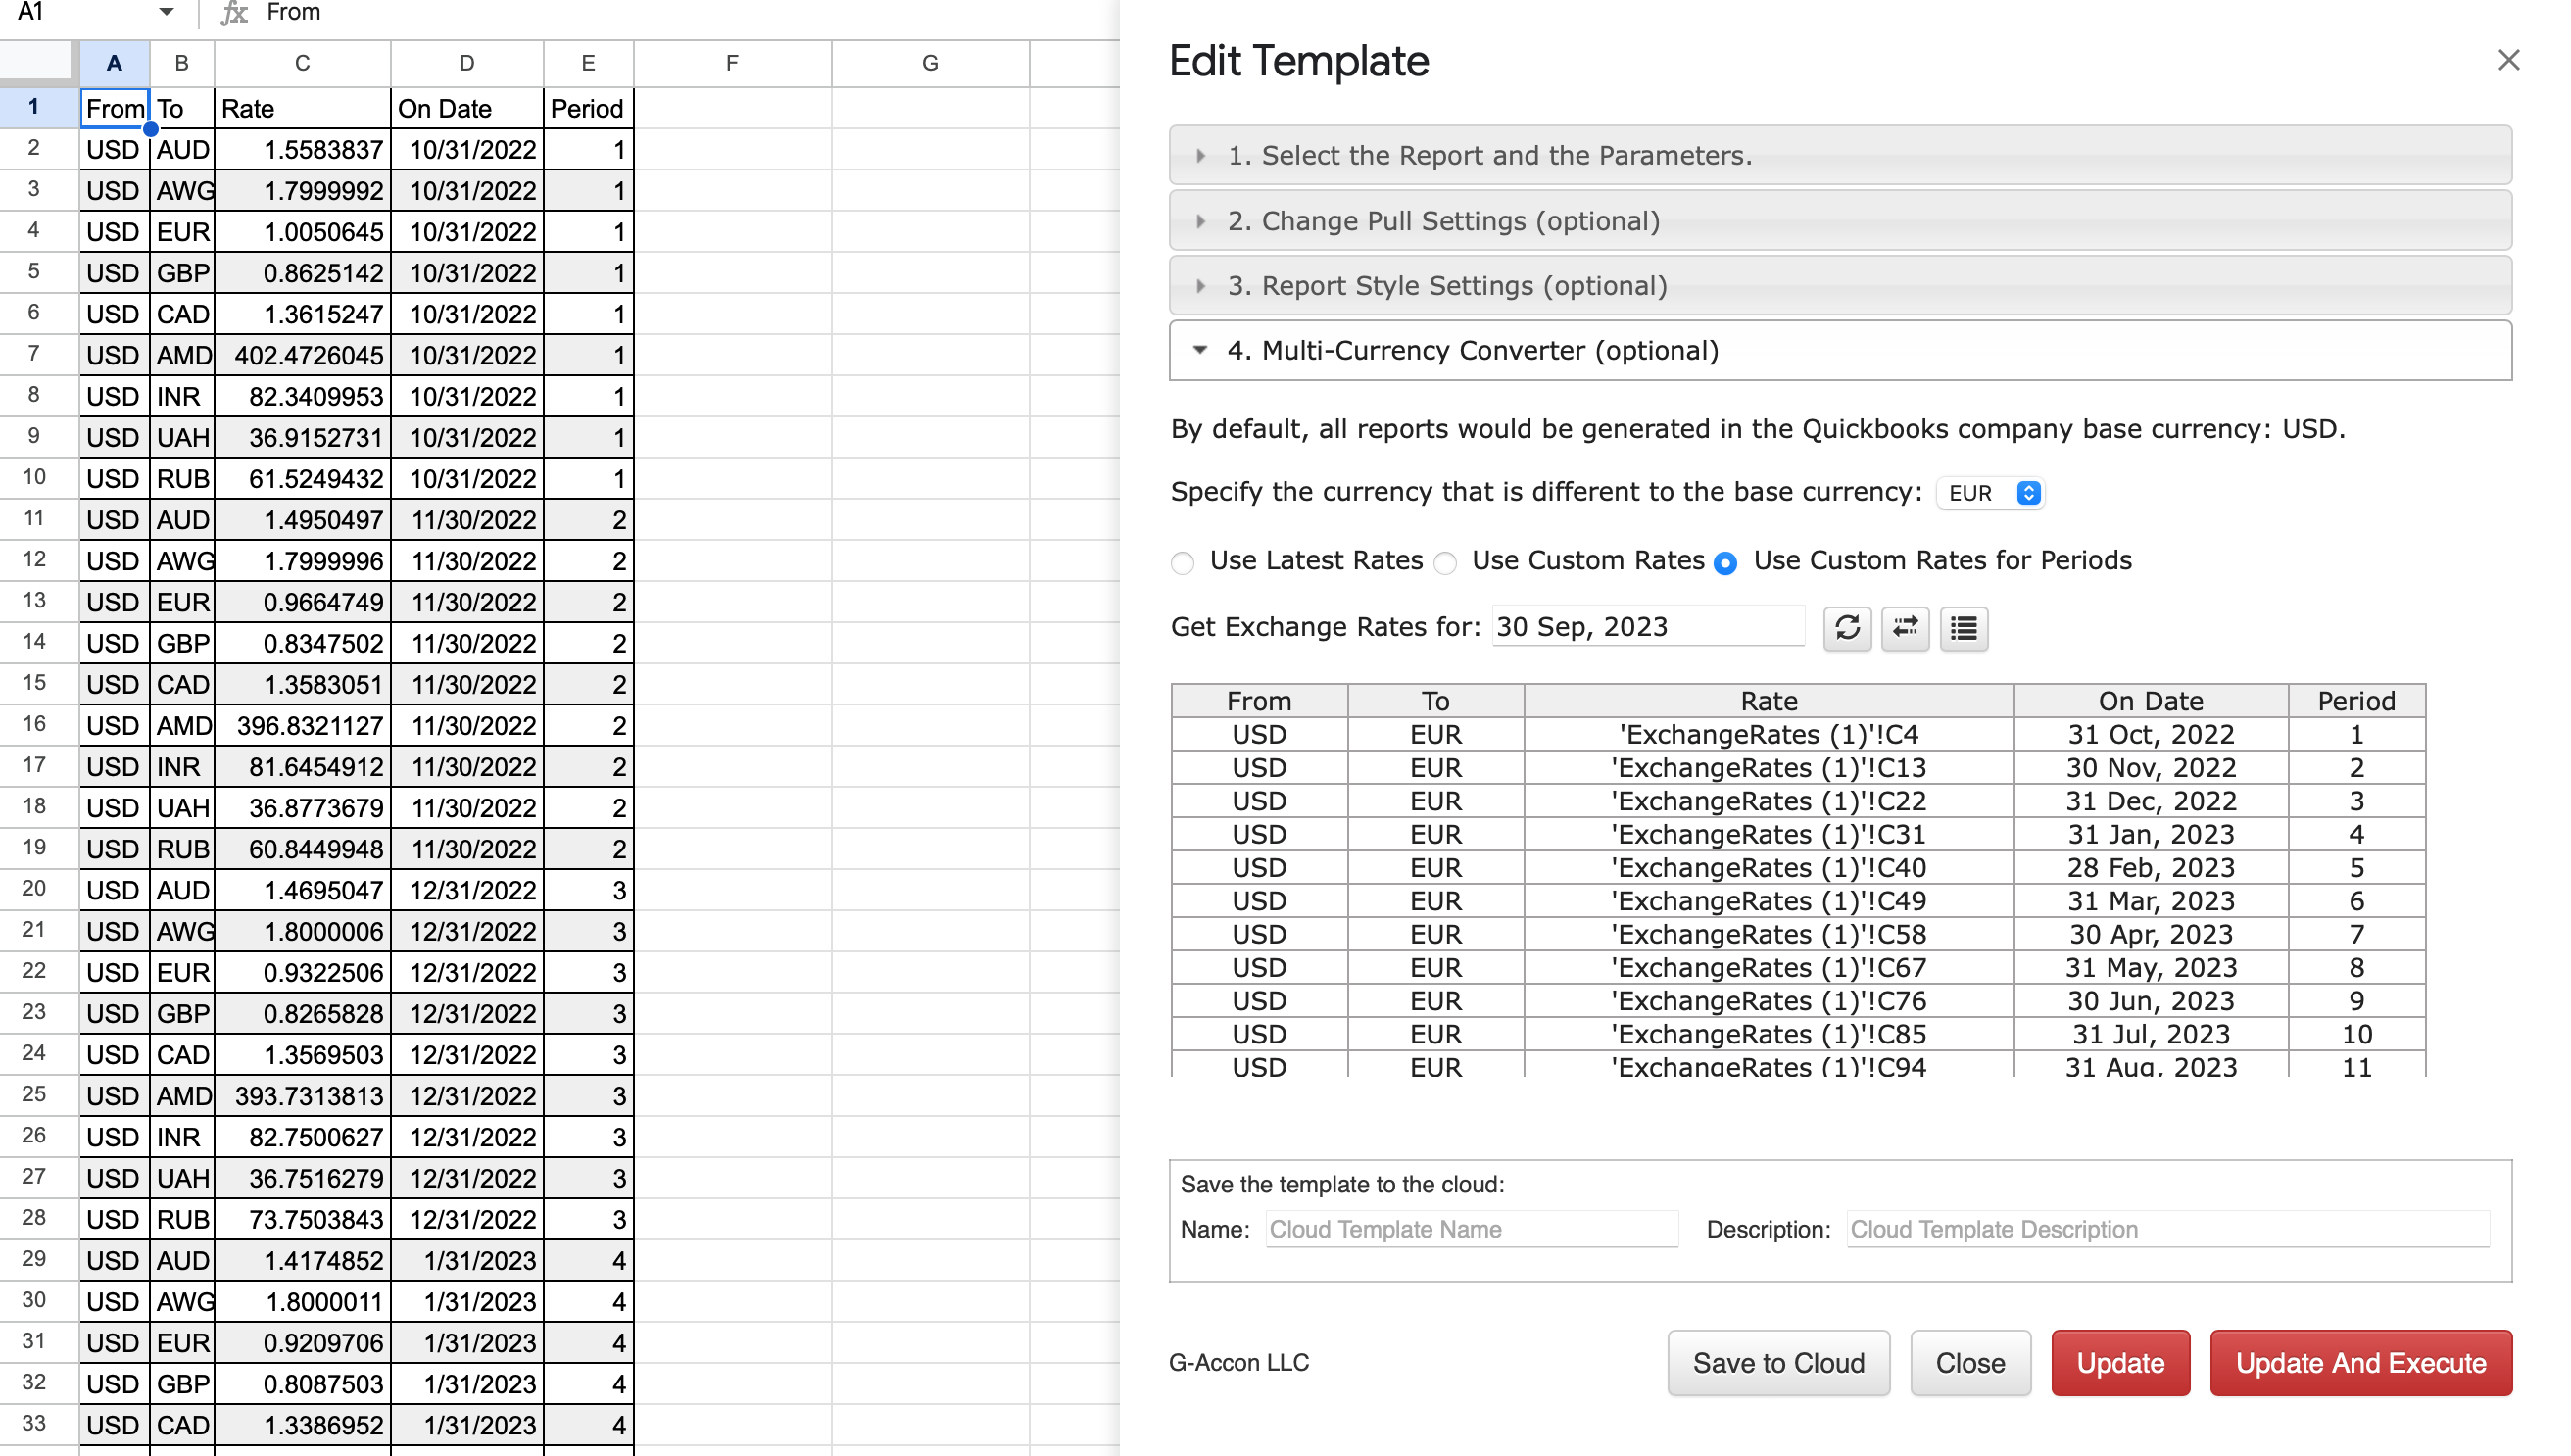
Using Custom Rates for Periods: Select "Use Custom Rates for Periods" and set custom rates for specific periods. You can use the exchange rate screen or create a separate tab for this purpose.
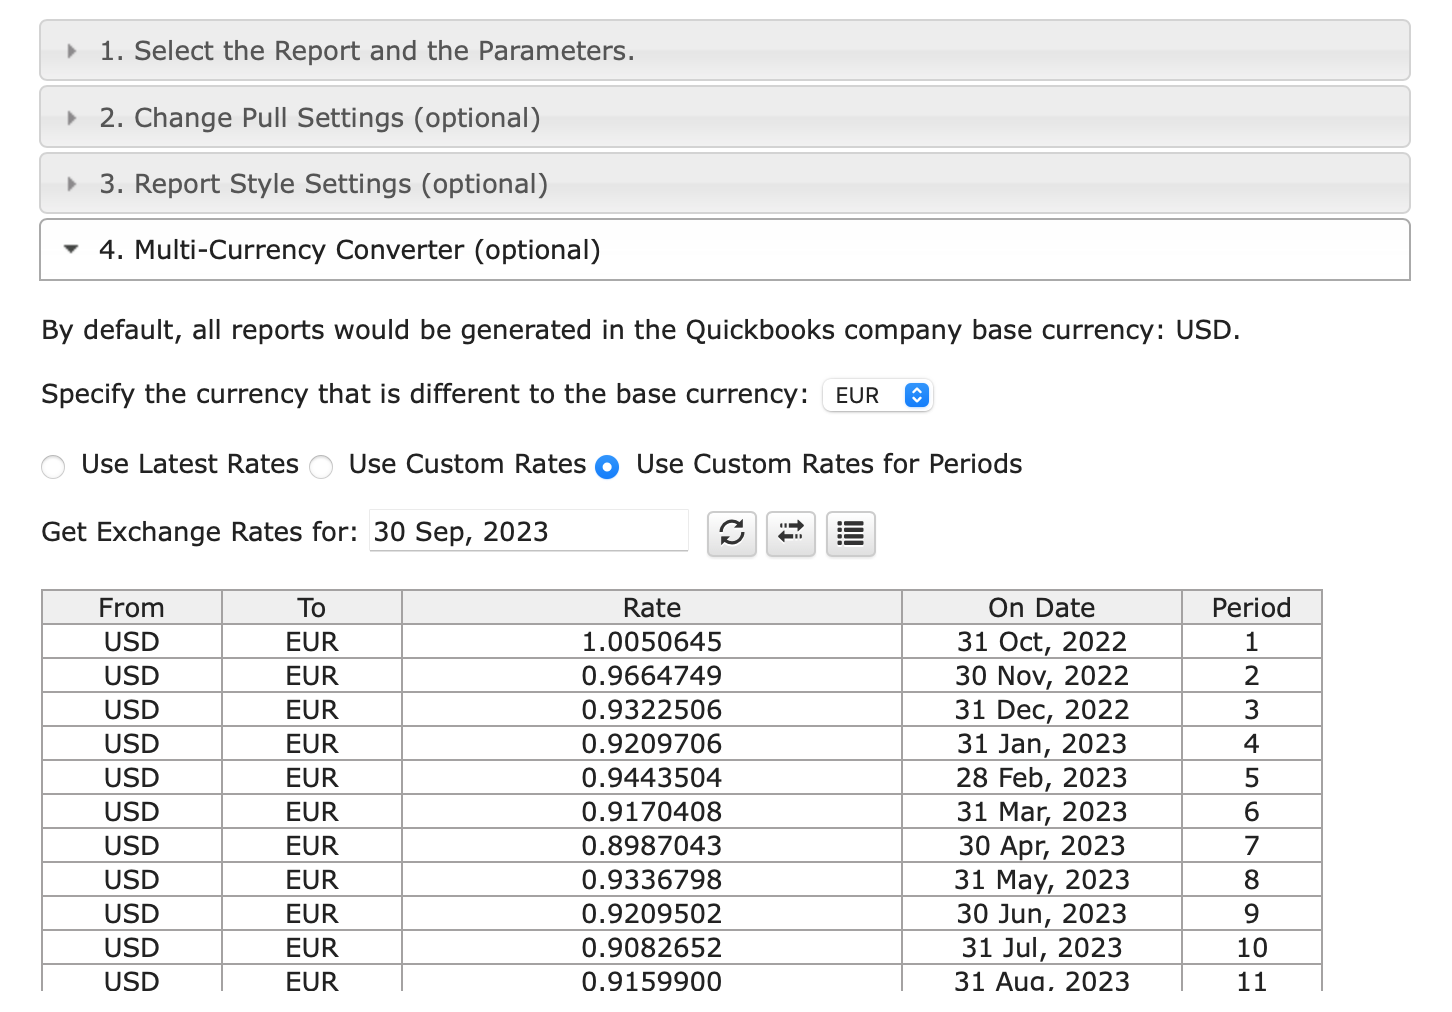
Use Custom Rates for Periods panel for setting exchange rates across multiple periods
Custom exchange rates tab showing rates entered for multiple report periods

Finally, click "Execute" to generate the report in your chosen currency, and it will appear in your Google Sheet.


How to schedule automatic data refresh?

To schedule automatic data refresh, follow these steps:
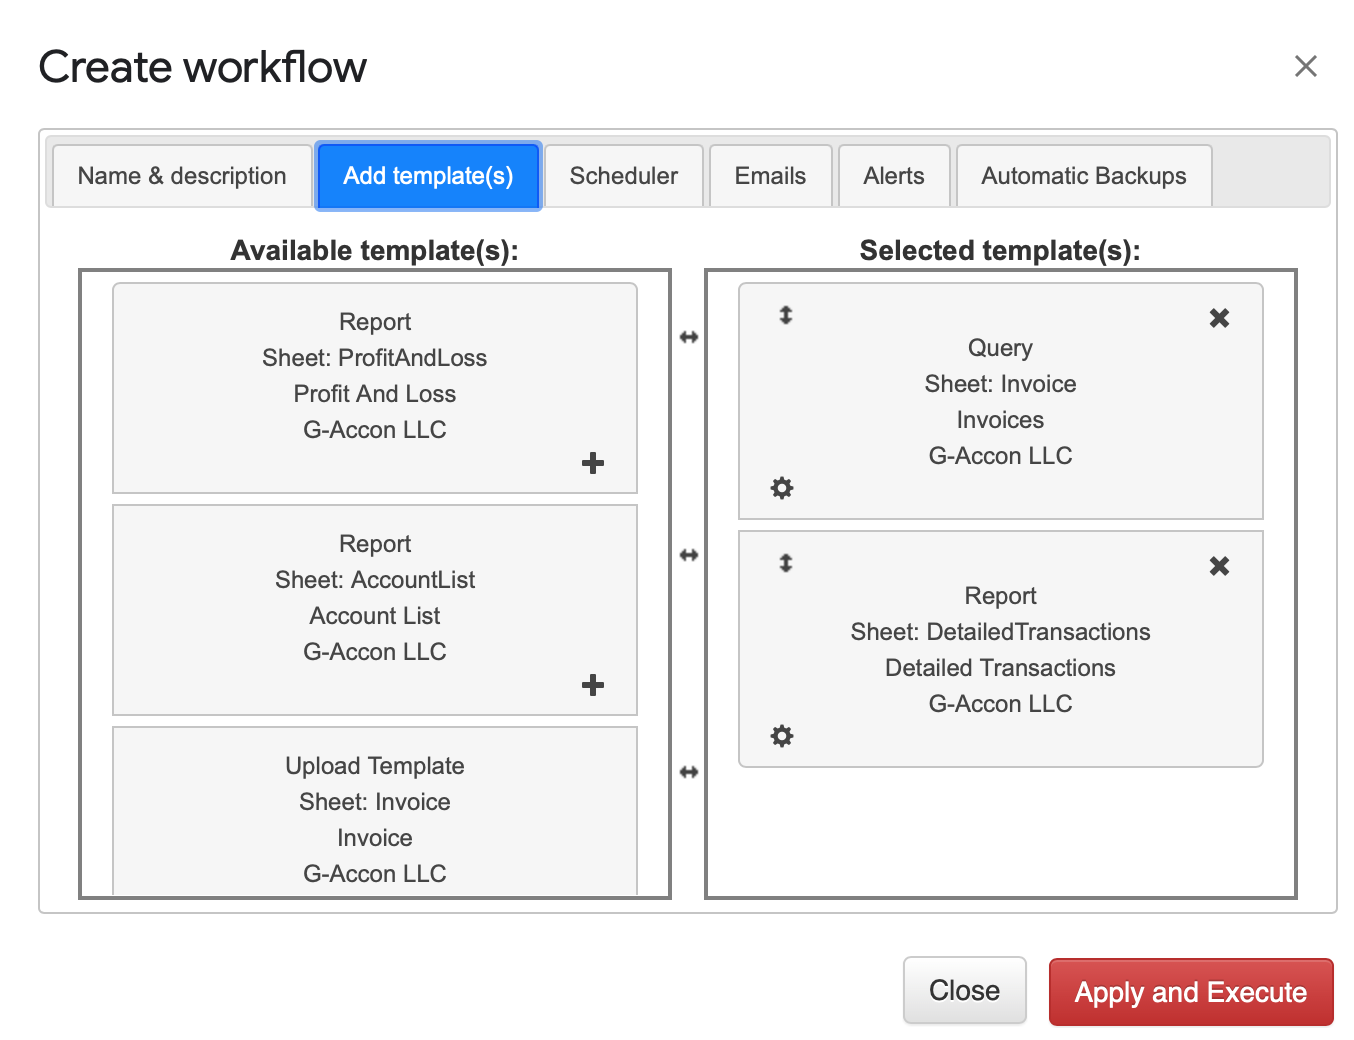
  • Create a workflow by selecting the "Create Workflow" option.
  • In this workflow, you can set up auto-refresh and notification processes.
  • Automatic workflows allow you to create various workflows, add specific templates, and set different schedules for each workflow.
  • You can also notify customers, clients, and team members with various automatic notifications, all within the same spreadsheet.
  • For more details, refer to the "Create Workflow" documentation here.

How modify your report and update your template?

During the refresh process, if you need to modify your report, follow these steps:
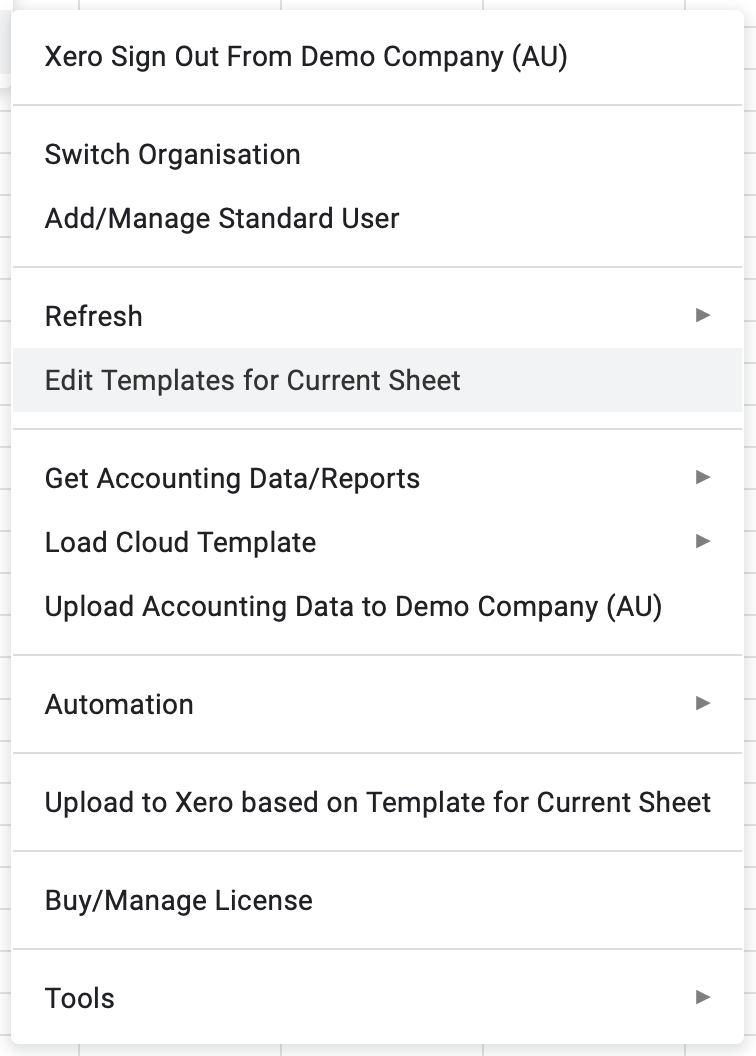
  • Click on "Extensions" in the menu.
  • Choose "G-Accon for Xero"
  • Select "Edit Templates for Current Sheet"
  • To Refresh and Modify a template there is no need to be signed in into the organization

Select the template, make the necessary changes to it andย Updateย the template orย Update and Execute ย the new query.


ยฉ Copyright 2026 G-Accon
crossmenuchevron-down