Release updates for G-Accon for Xero/QuickBooks
G-Accon for QuickBooks: Changes/Enhancements released in October, 2024
Watch latest videos in G-Accon Integration channel
NEW BI-Friendly Reports:
Our BI-Friendly Reports make building advanced dashboards easier than ever, integrating seamlessly with Power BI, Looker (Google Data Studio), Tableau, and other Business Intelligence (BI) tools.
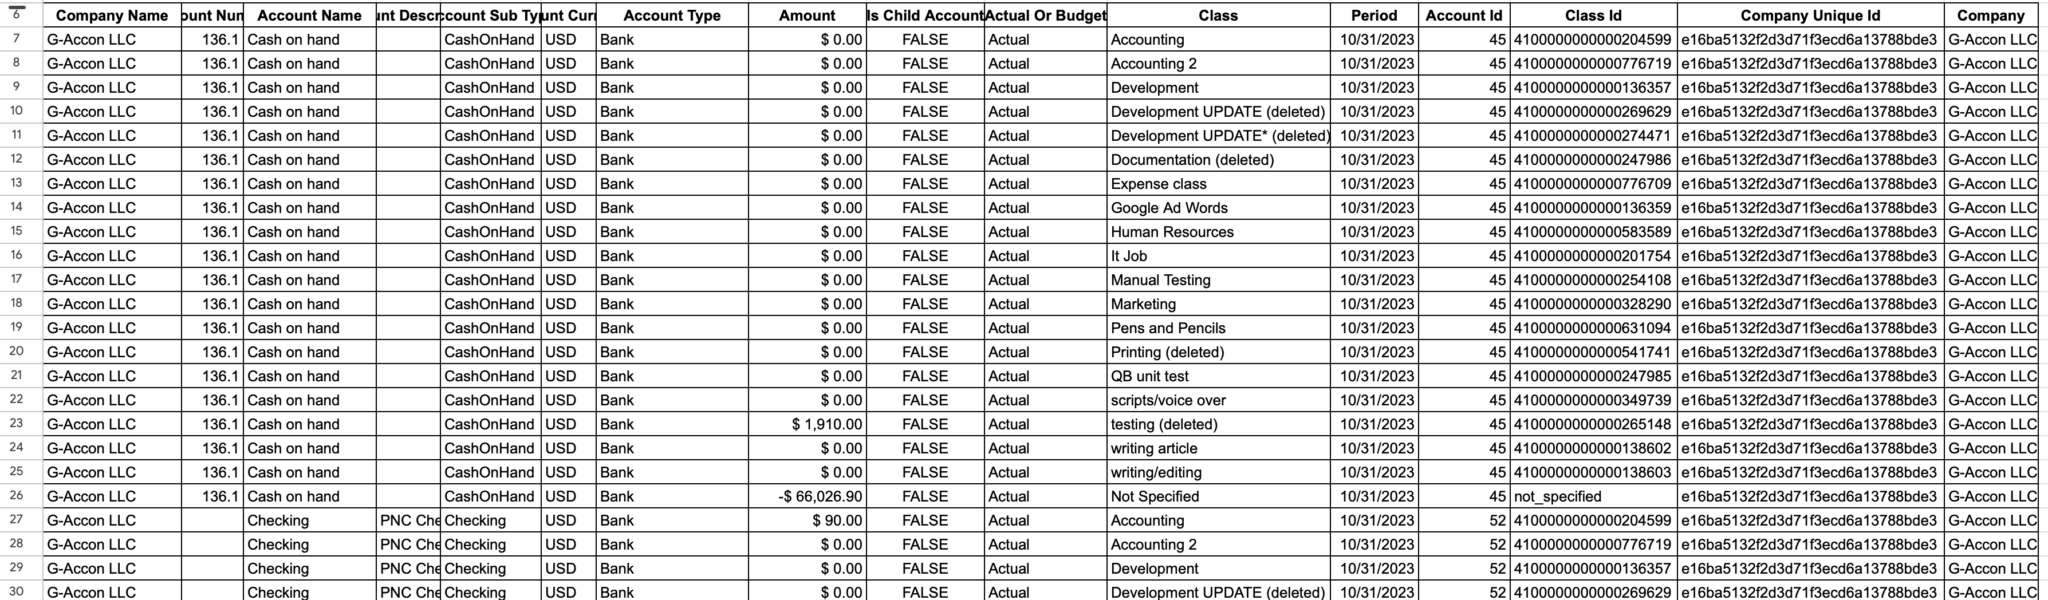
Effortlessly connect and create powerful dashboards for deep data insights, modeling, and forecasting. Access detailed reports, including Transaction List, P&L, Balance Sheet, Detailed Transaction Report, Cash Flow, and more. Each report includes internal IDs, enabling complex queries and advanced analysis.
These are reports designed to be compatible with Business Intelligence (BI) tools, allowing easy integration, analysis, and visualization of data. They are structured in a way that facilitates efficient data extraction, manipulation, and interpretation, enabling users to make data-driven decisions quickly.
These reports often follow best practices in data organization, formatting, and presentation to ensure clarity and usefulness within BI platforms.
Step 1. Select BI-Friendly Reports under Get Accounting Data/Reports menu option
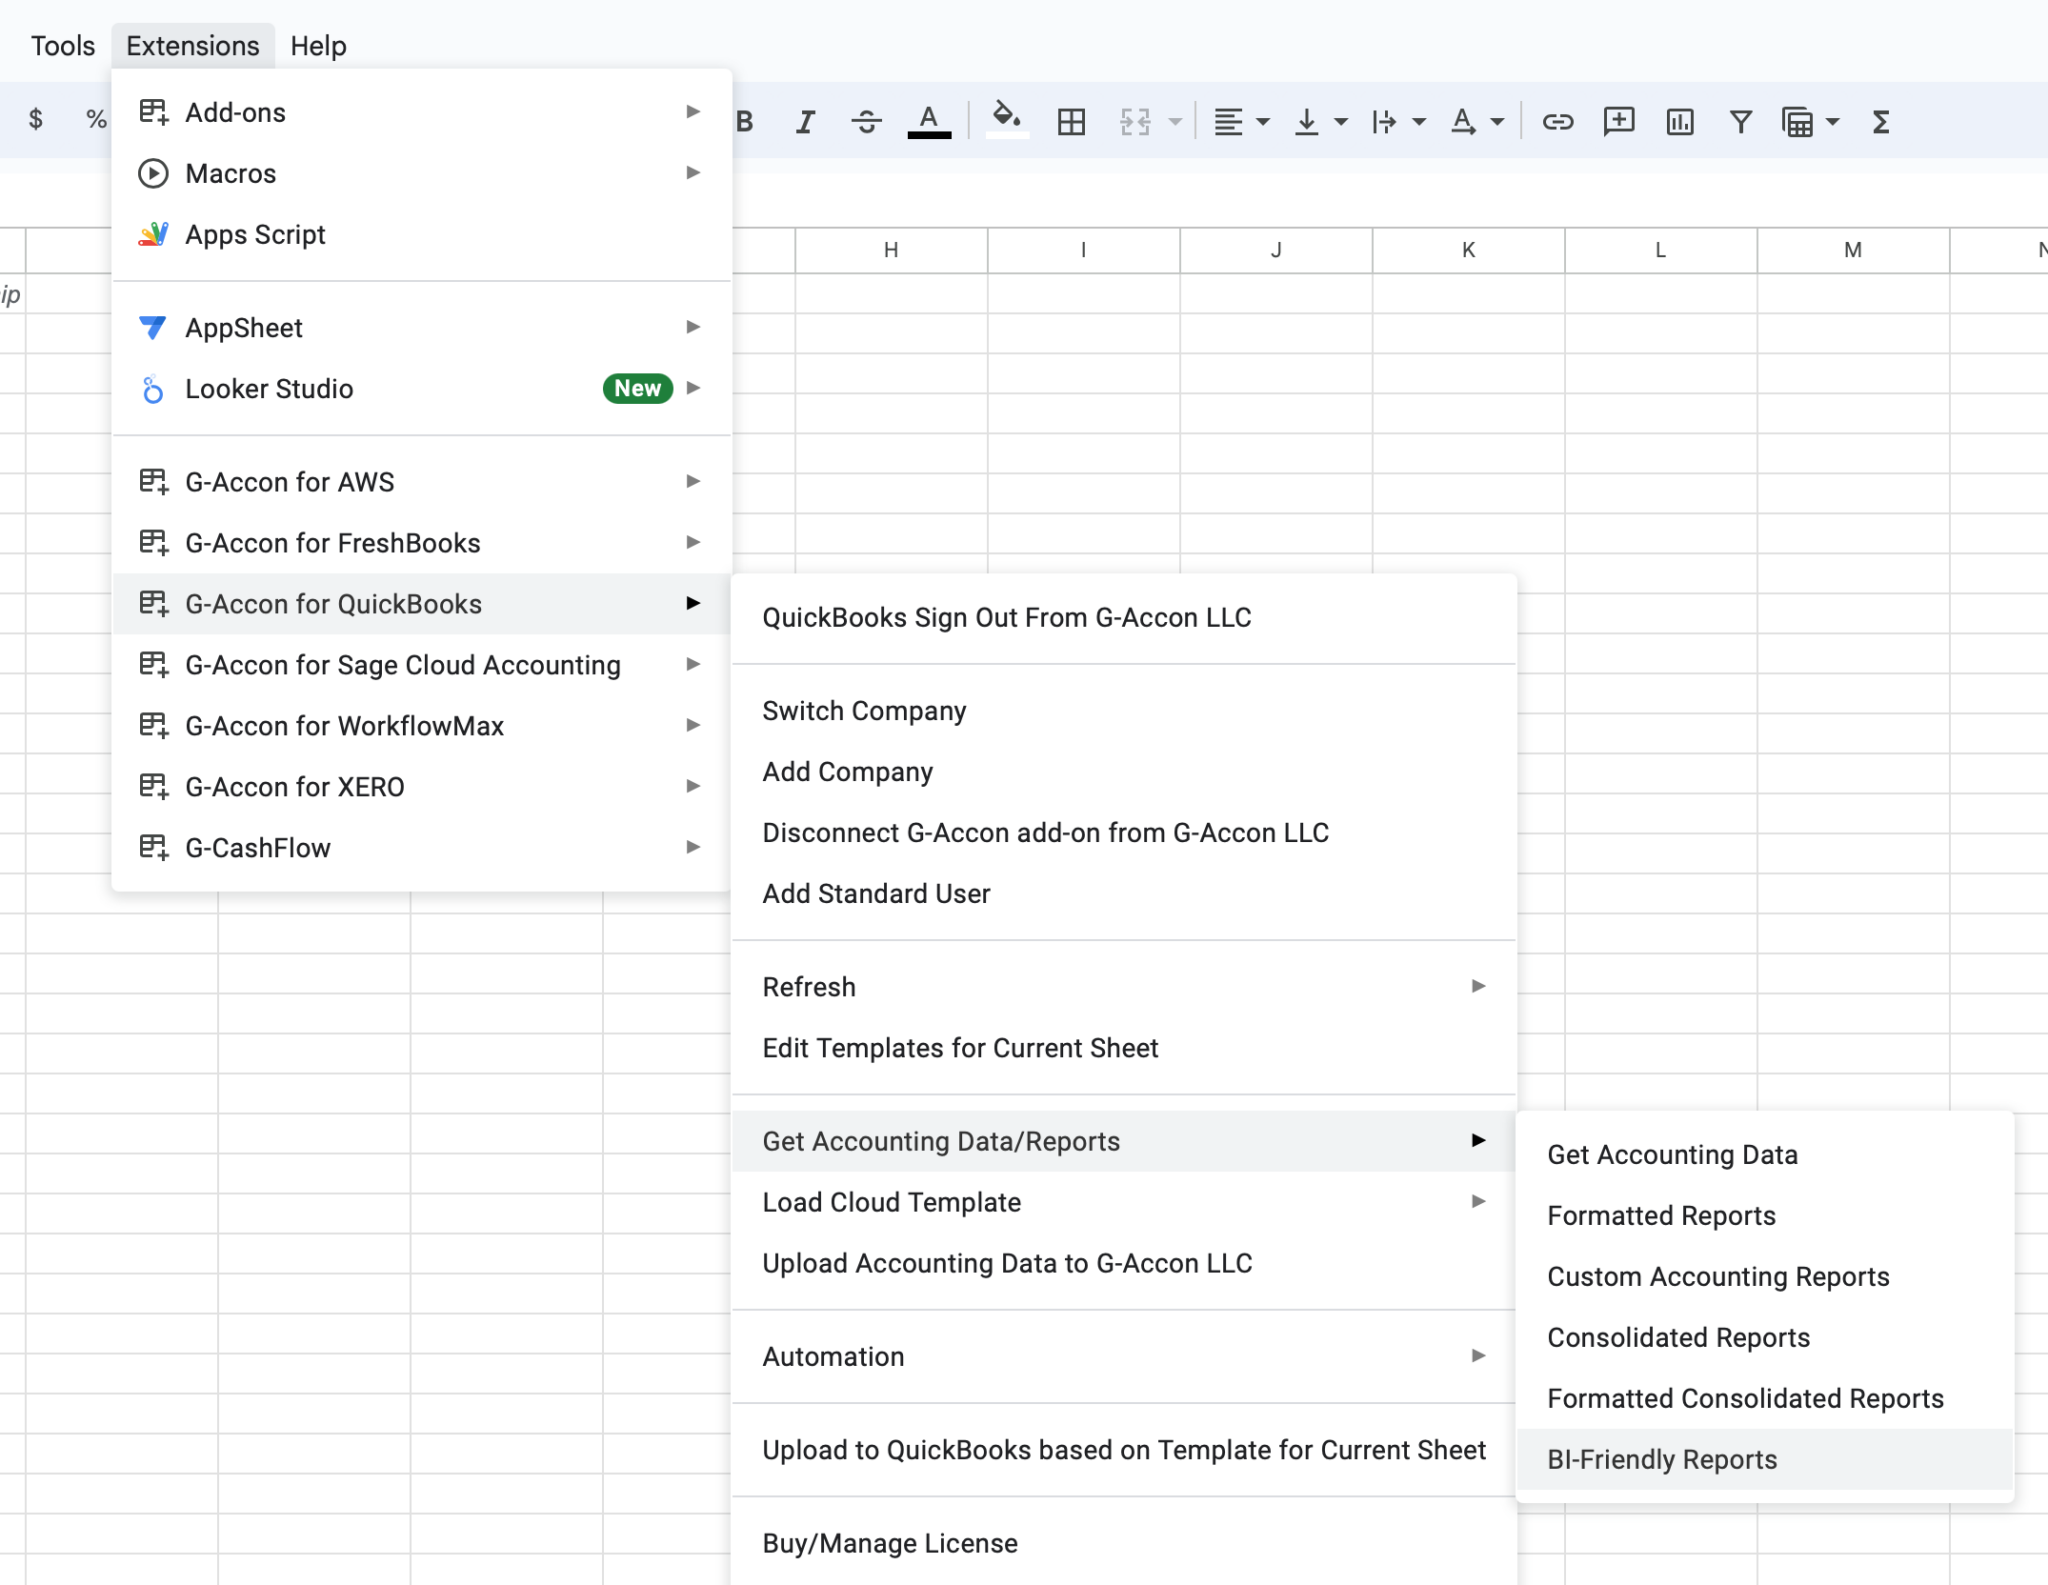
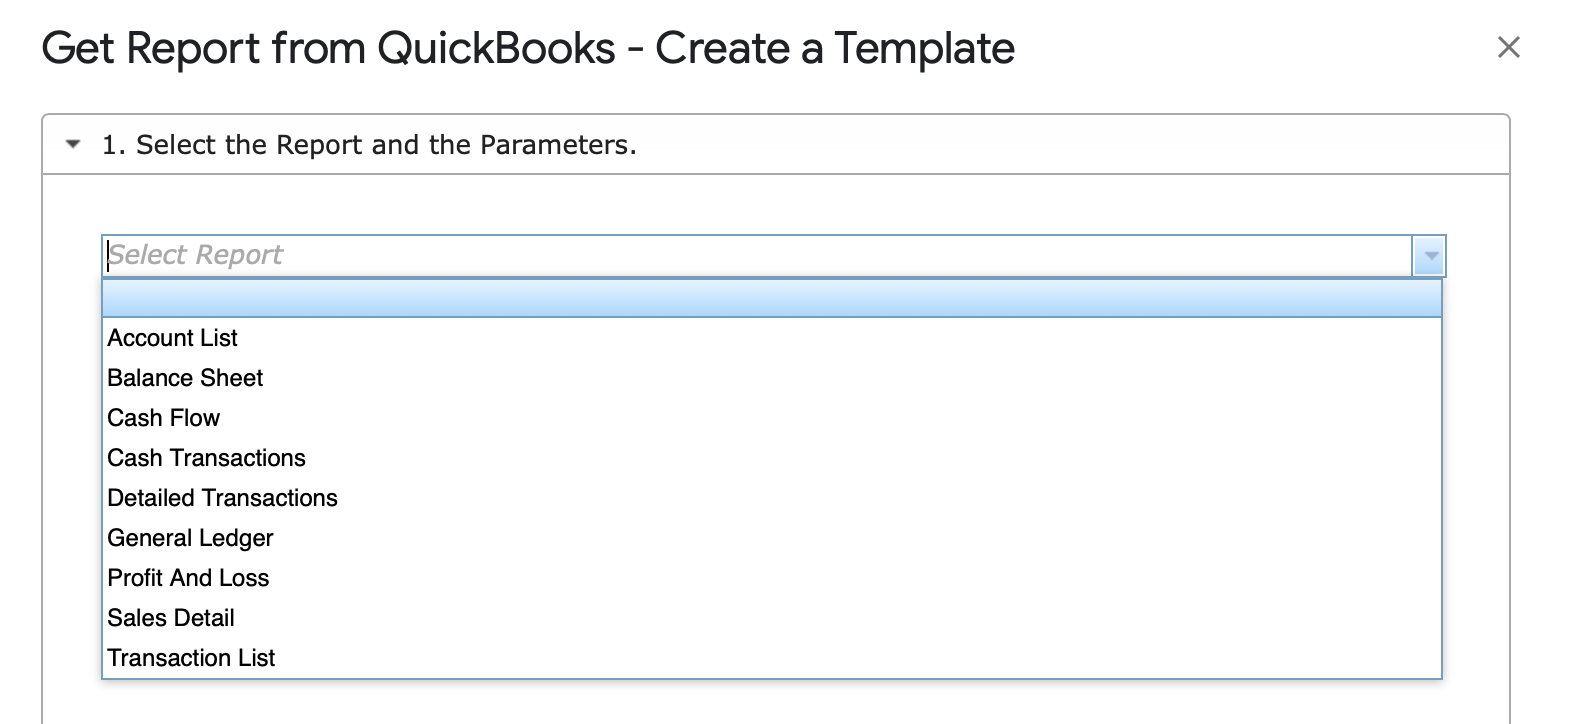
Step 2. Select a report from the dropdown list.
☑ Account List
☑ Balance Sheet
☑ Cash Flow
☑ Cash Transactions
☑ Detailed Transactions
☑ General Ledger
☑ Profit and Loss
☑ Sales Detail
☑ Transaction List
Step 3. Select all attributes for the selected reports and needed settings from the Change Pull Settings option
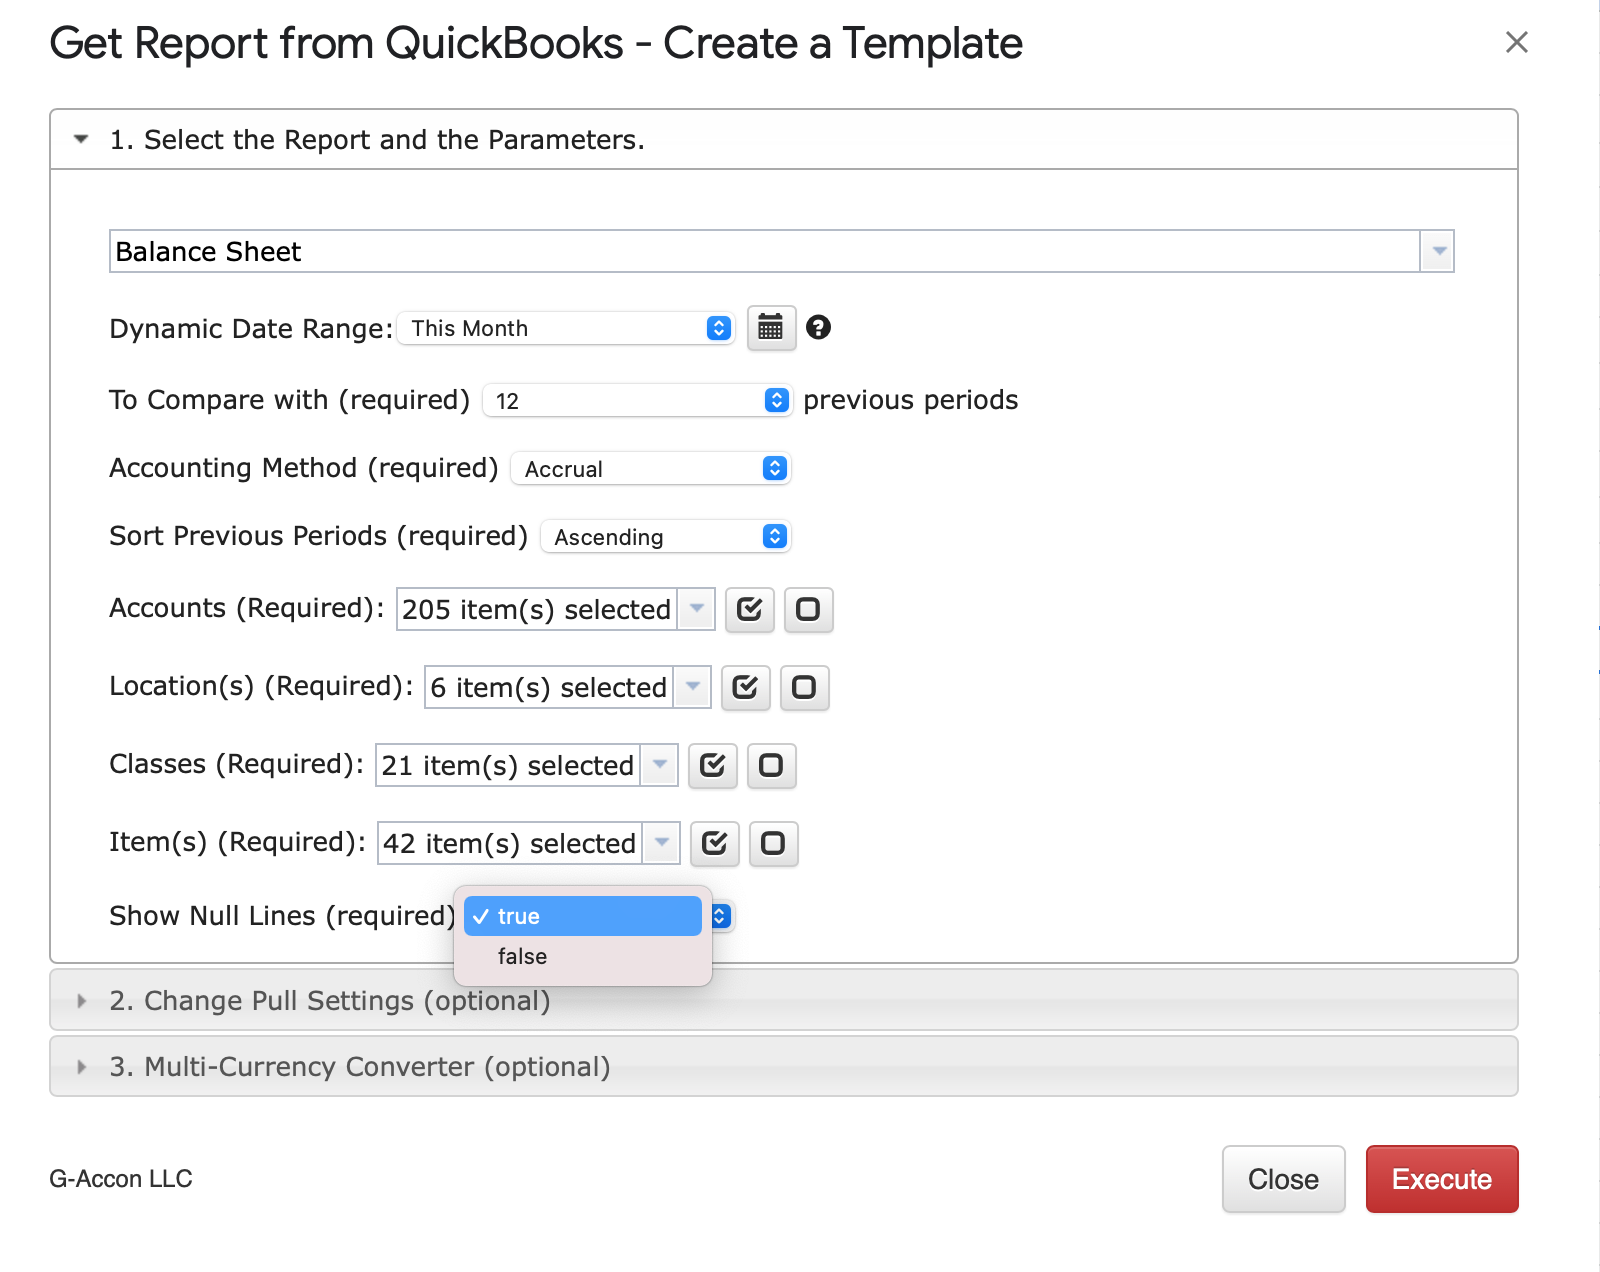
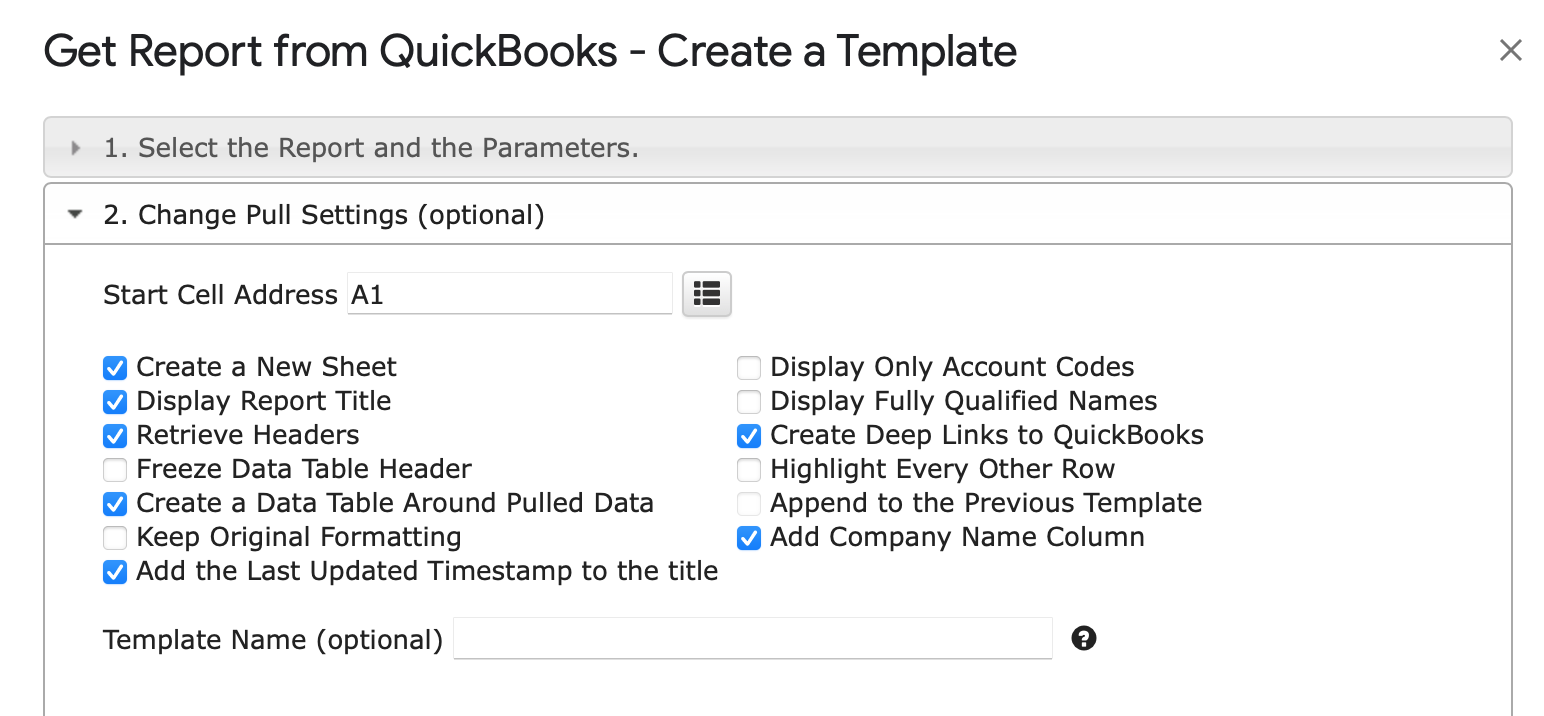
Step 3. Click on Execute button to generate a report
Using G-Accon to create BI-friendly reports in Google Sheets offers several key benefits:
G-Accon simplifies reporting processes, enhancing the BI capabilities of Google Sheets with automation and data integration.
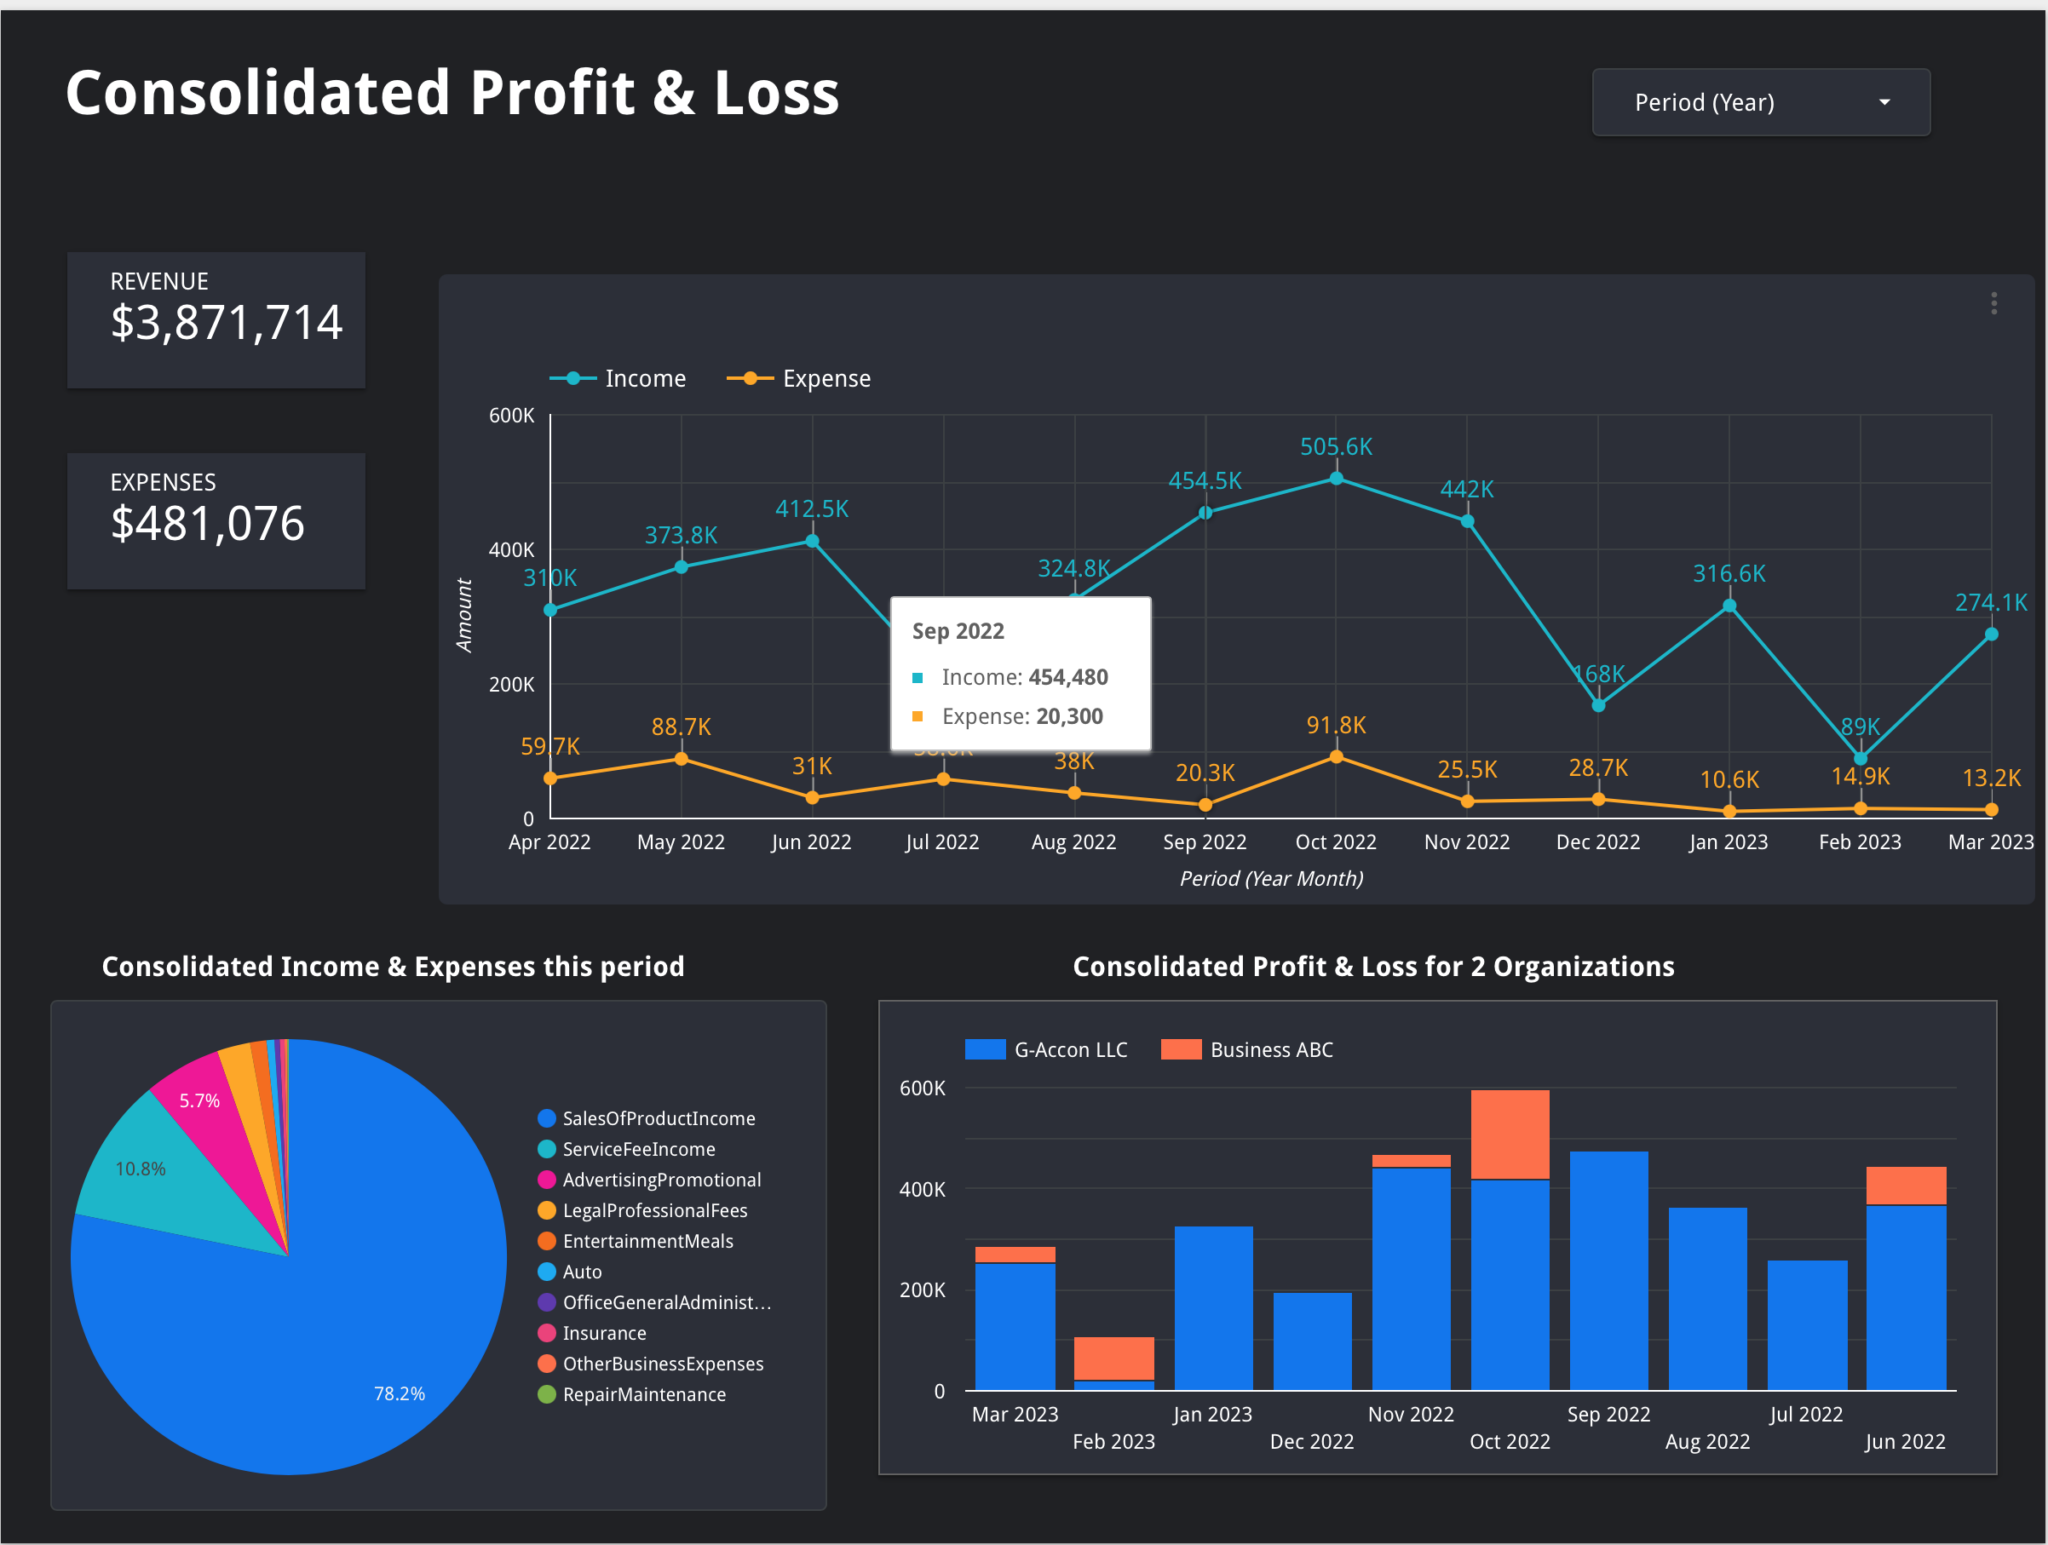
As a result of Business Intelligence (BI) reports, G-Accon users can create a wide variety of dashboards tailored to different business functions, with financial dashboards and KPI (Key Performance Indicator) dashboards being among the most critical types.
These dashboards translate complex data from BI reports into visual and easily digestible formats, helping businesses track performance, optimize operations, and make data-driven decisions.
Here is one of the example of the financial dashboards: