Google Charts provides a perfect way to visualize data on your website. From simple line charts to complex hierarchical tree maps.
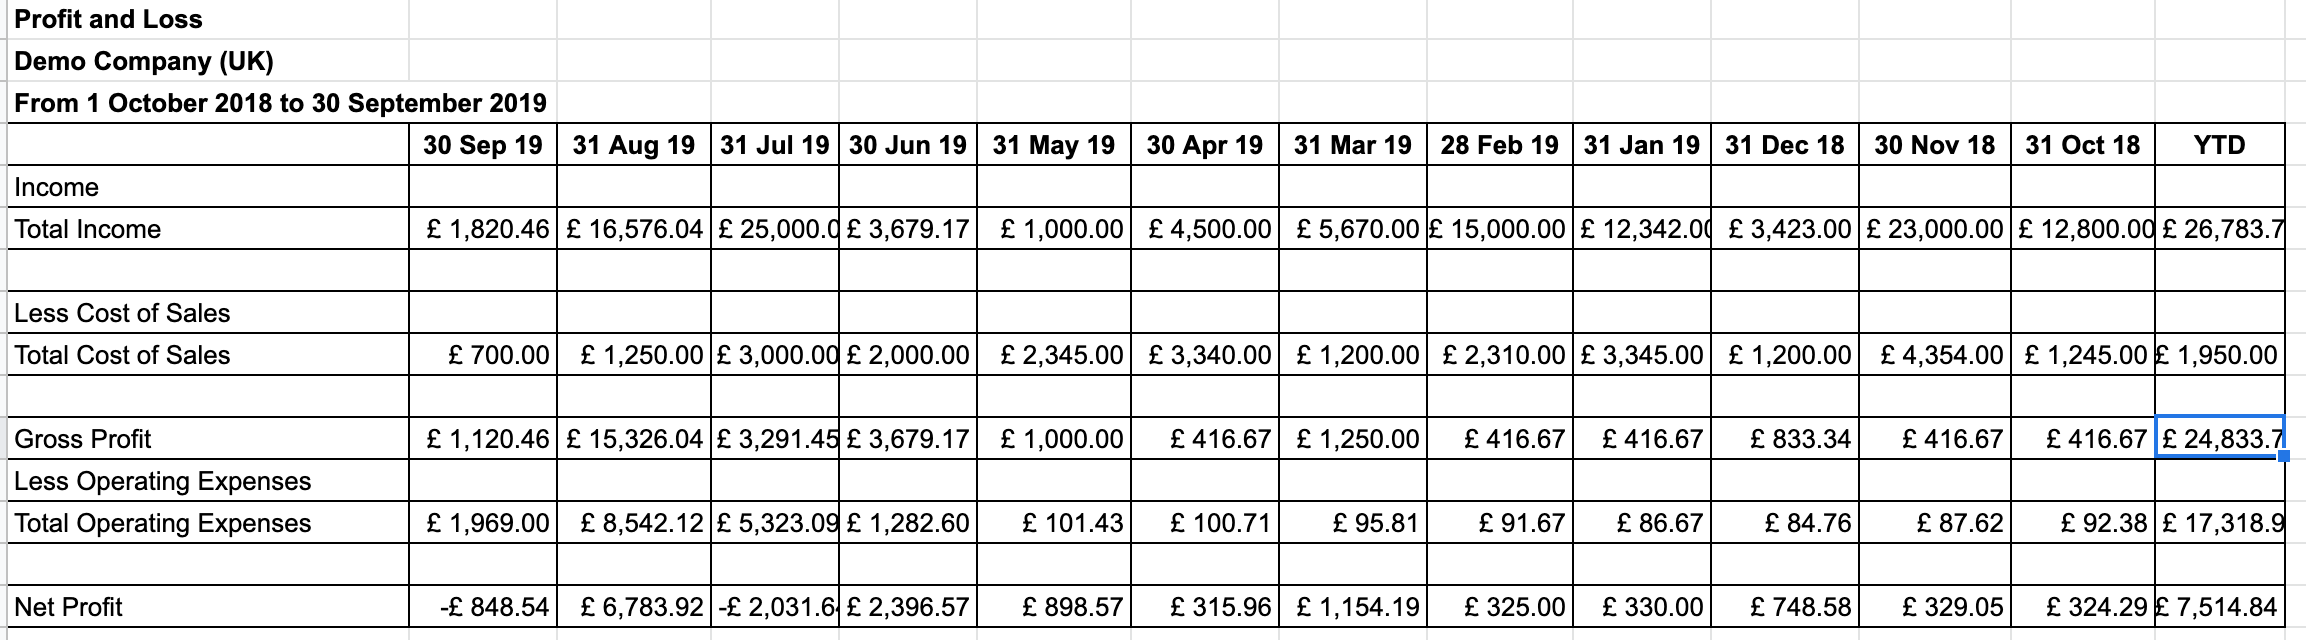
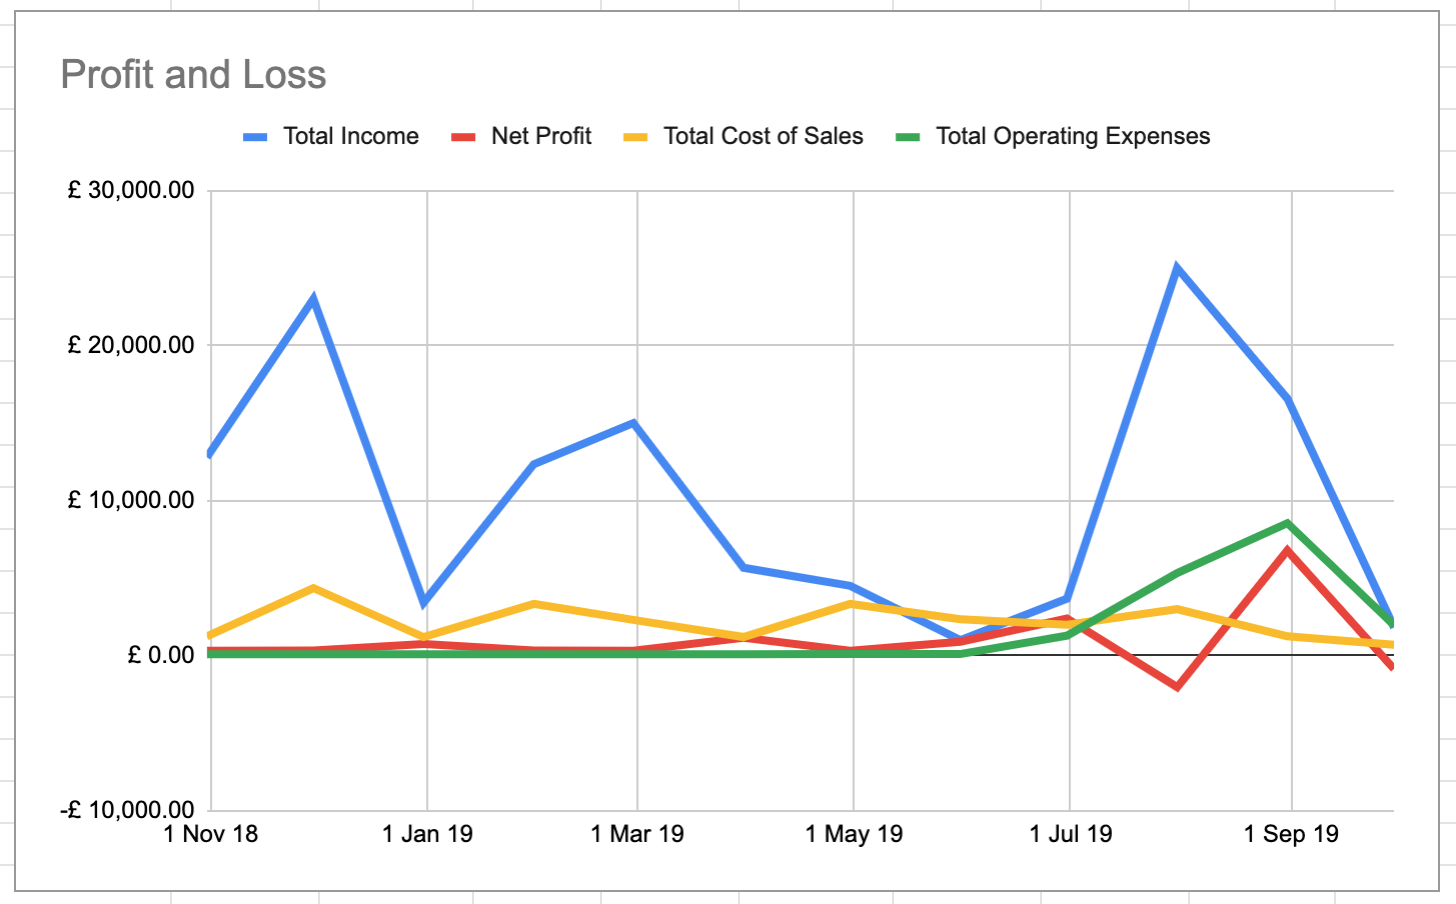
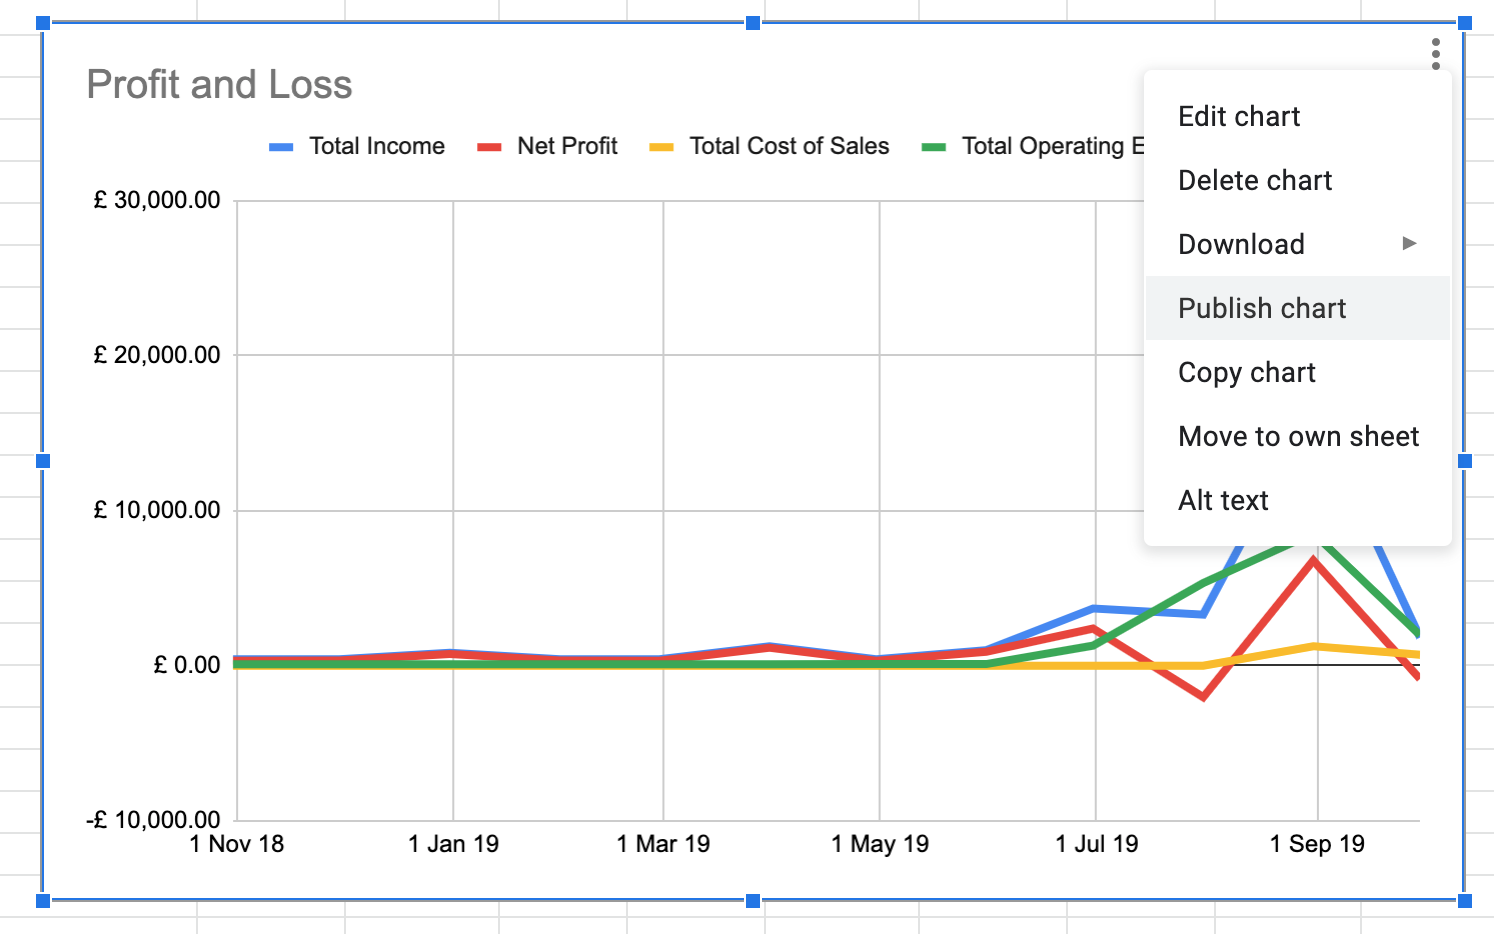
Here is the series of steps you need to perform to publish your Google Chart in web. This is Profit and Loss Report generated through G-Accon tool and a customized chart.
To publish Profit and Loss chart on your web page, you need to select your chart, click on the tree dots on the right corner of the chart, and select Publish chart option.
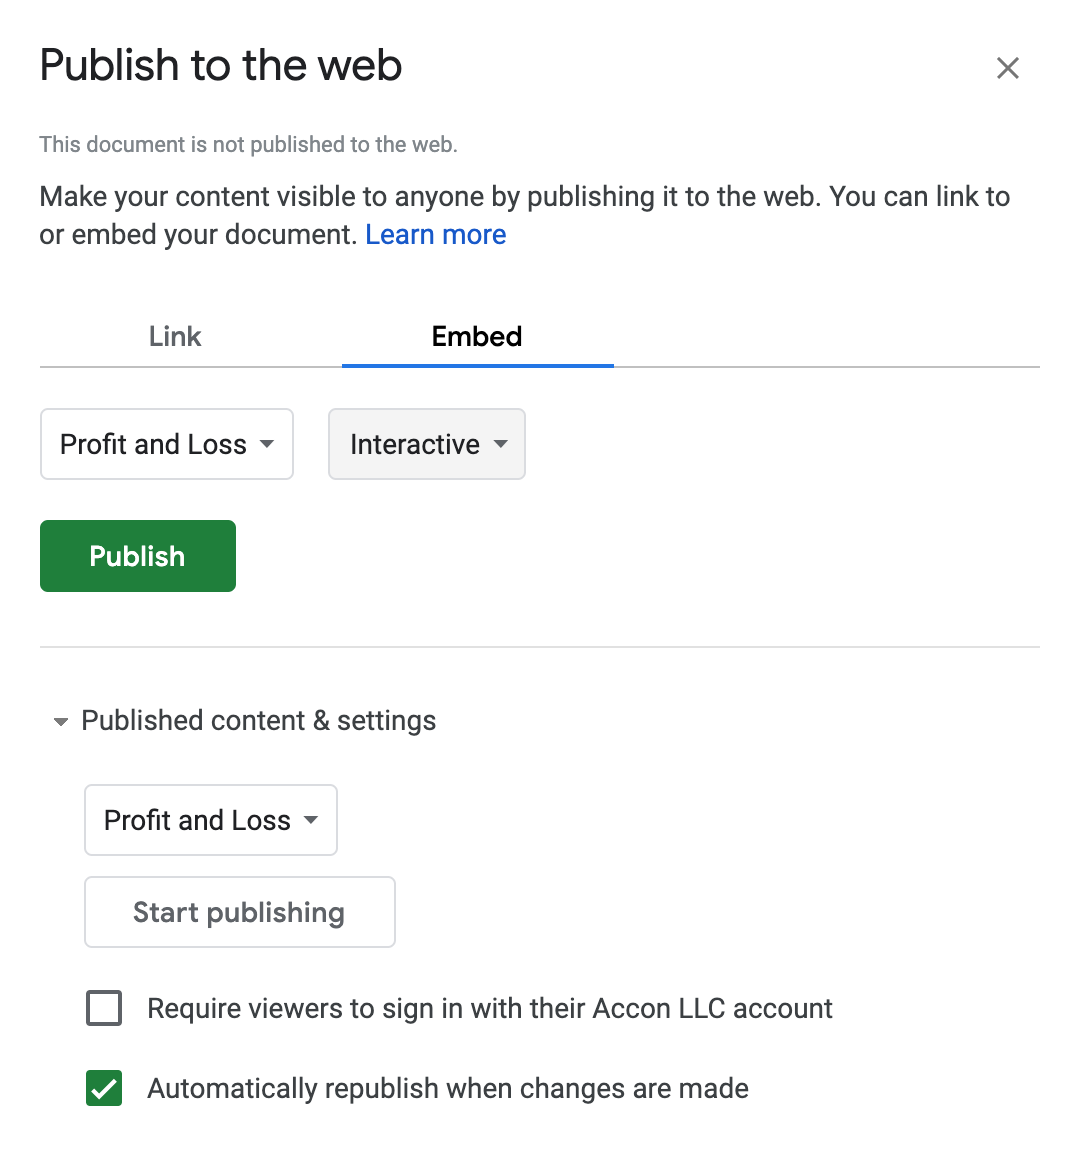
In the pop up window you need to select the desire chart and data, choose the Embed object and Interactive option, and click on the Publish button.
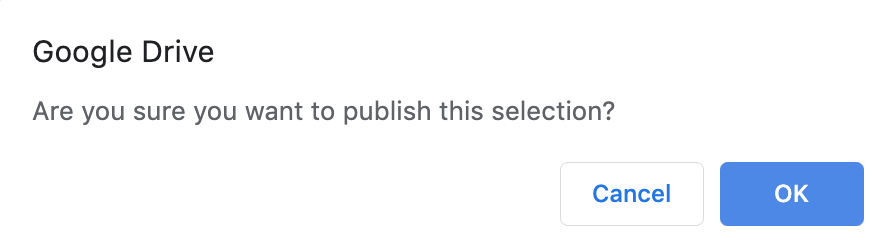
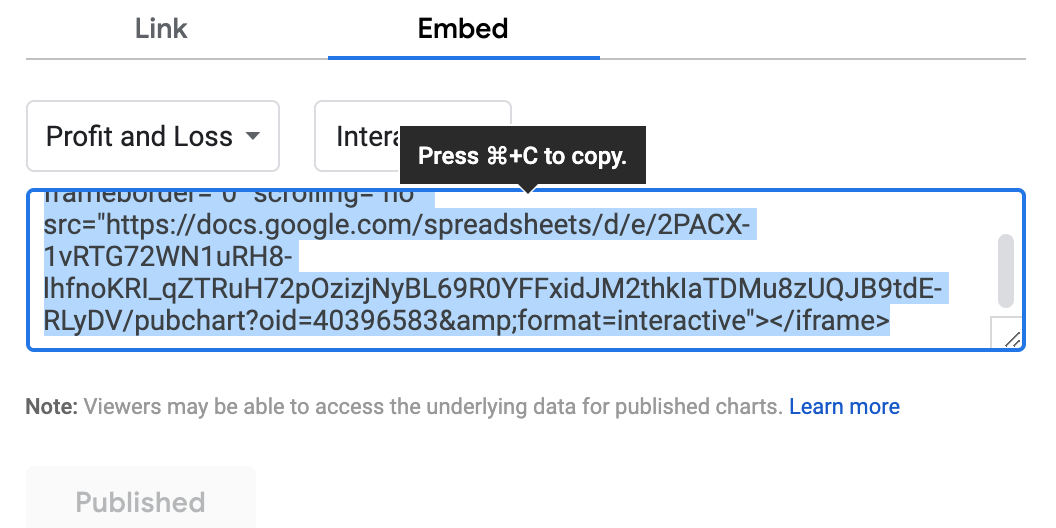
Click on "OK" to publish this selection and copy the link which contains the link to your embedded object. This link need to be inserted in your web page.
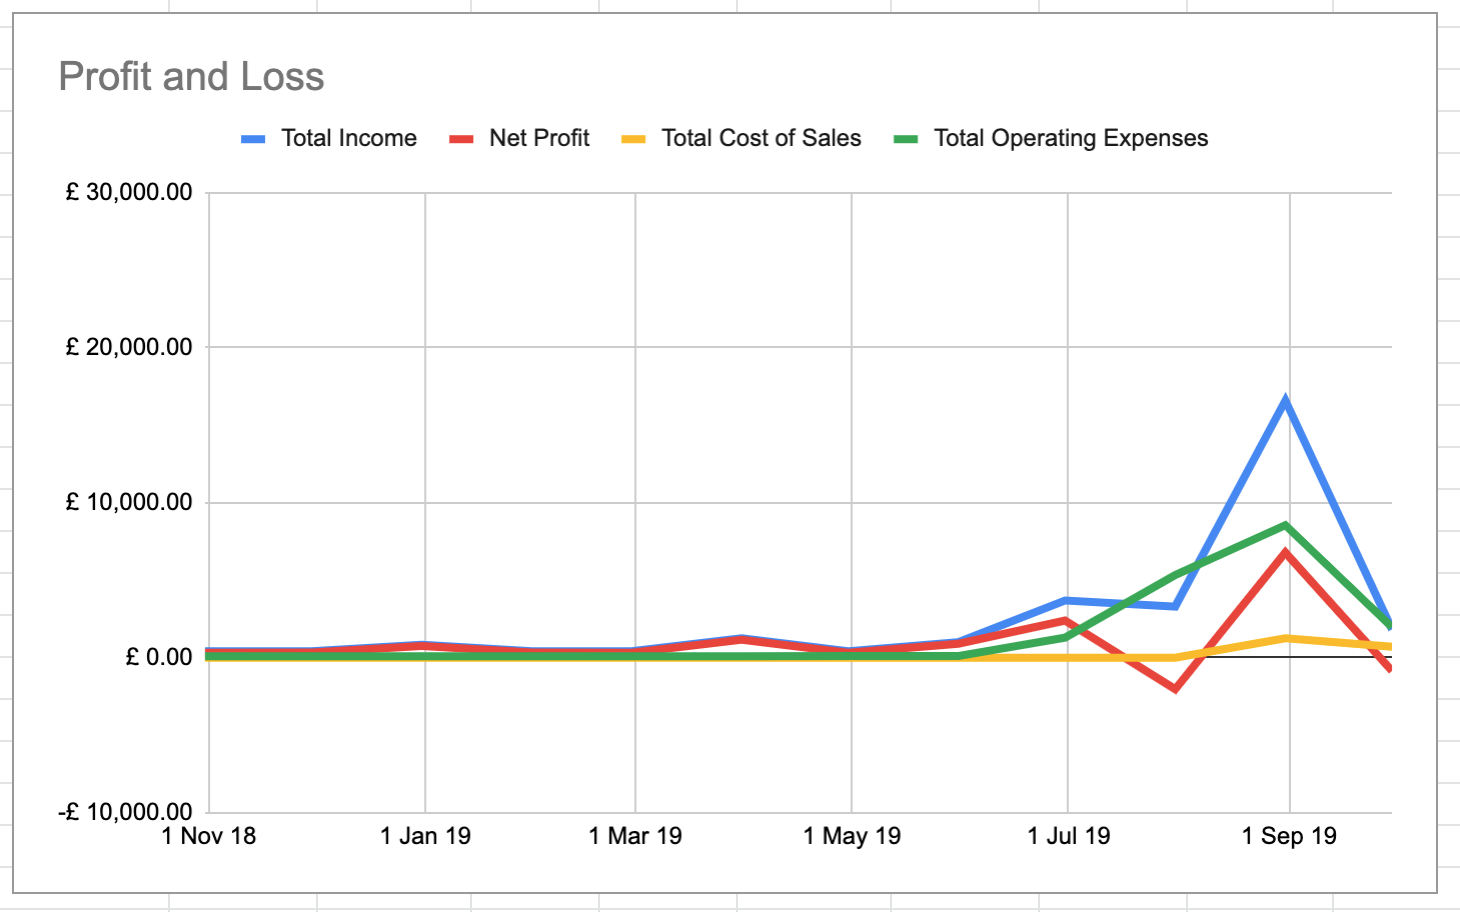
And finally, your chart will be part of your web page. It will be automatically updated based on your business logic.
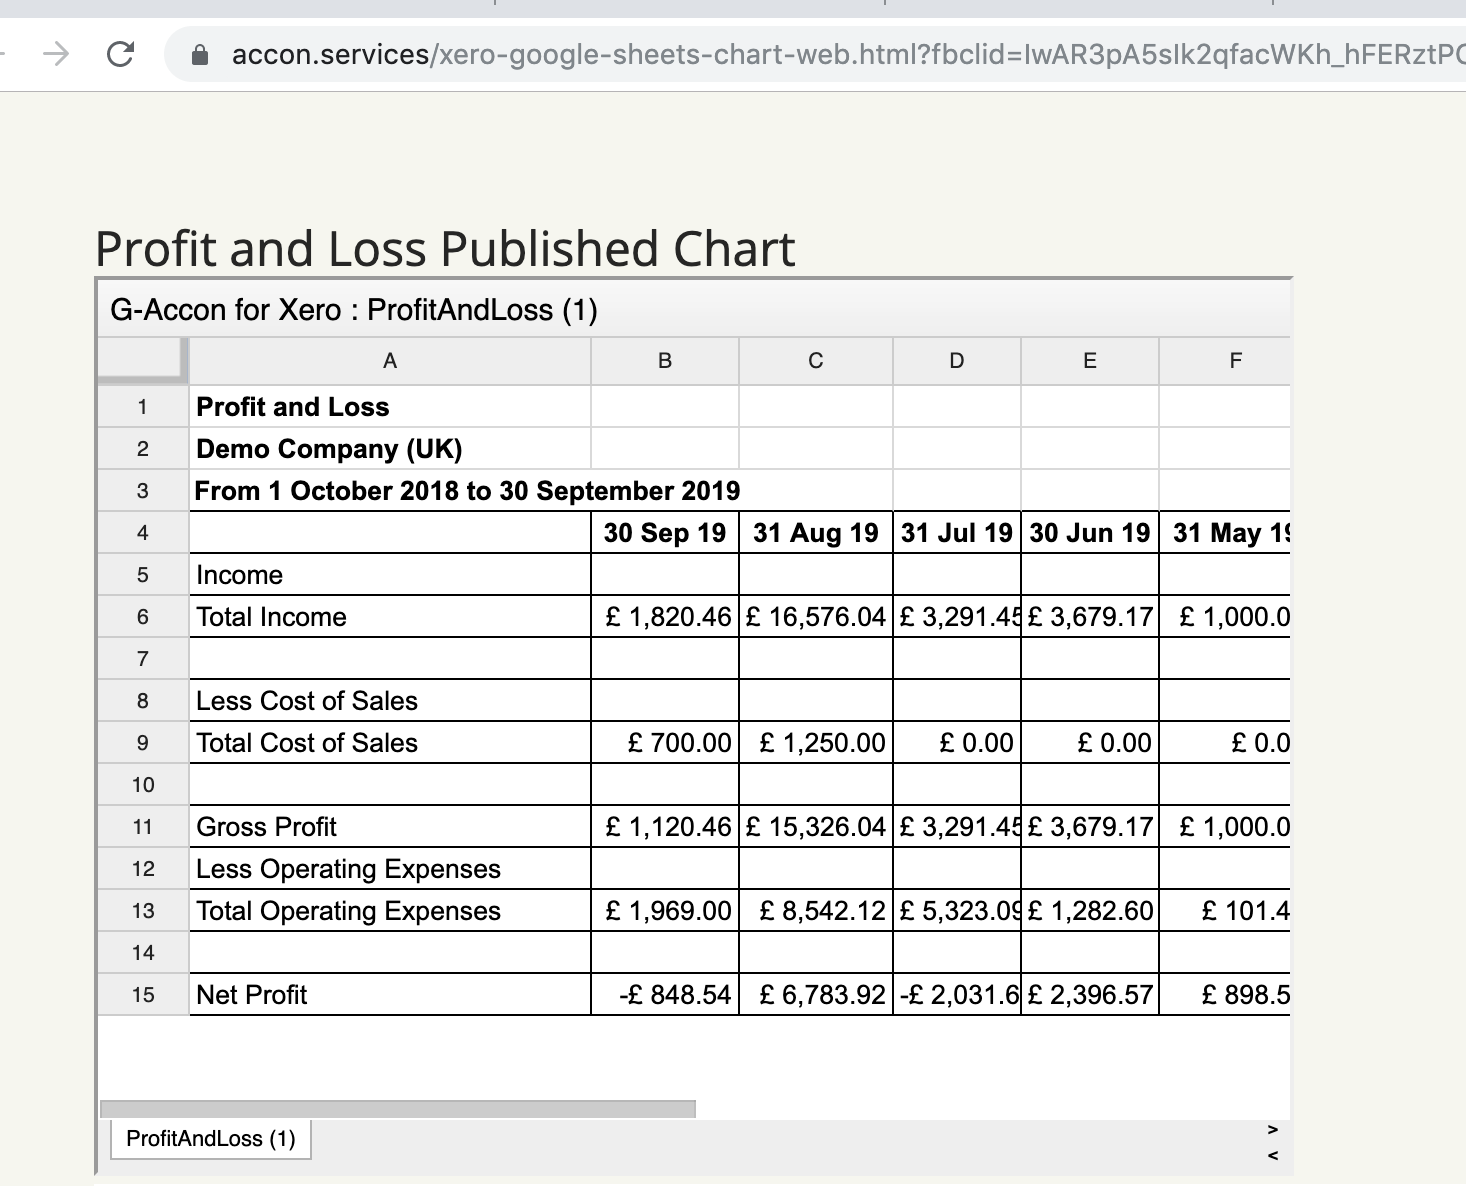
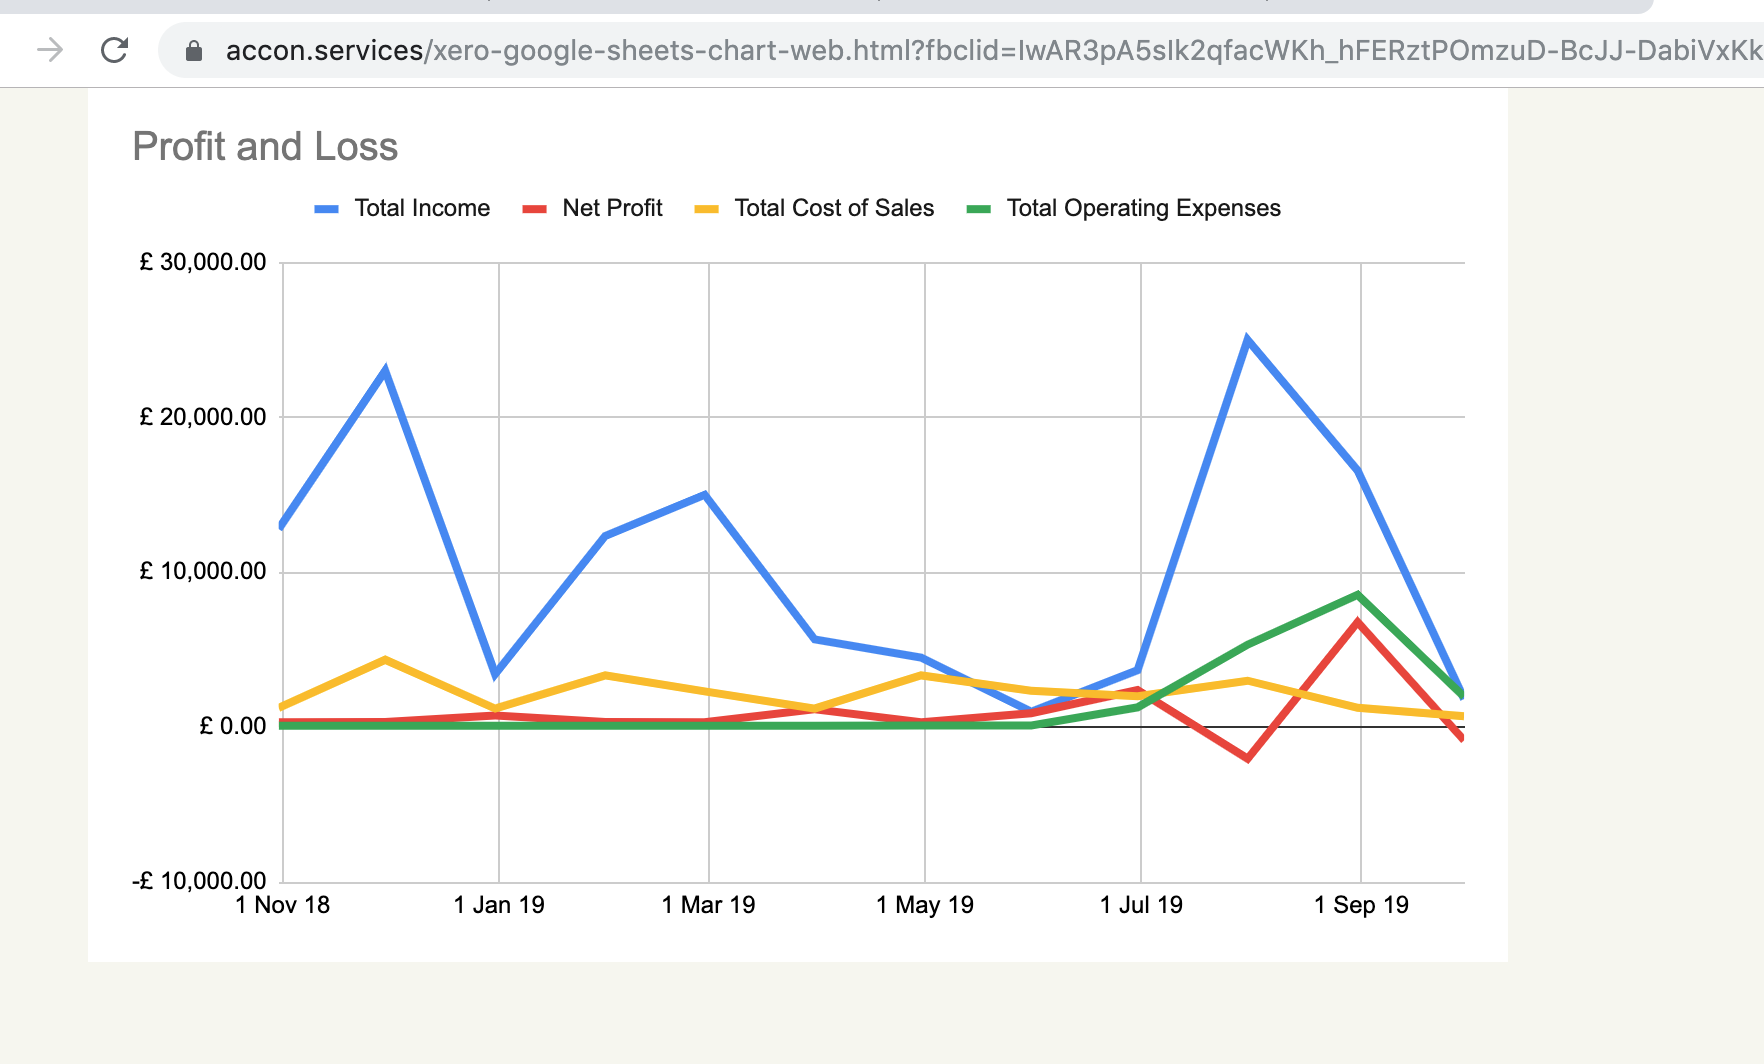
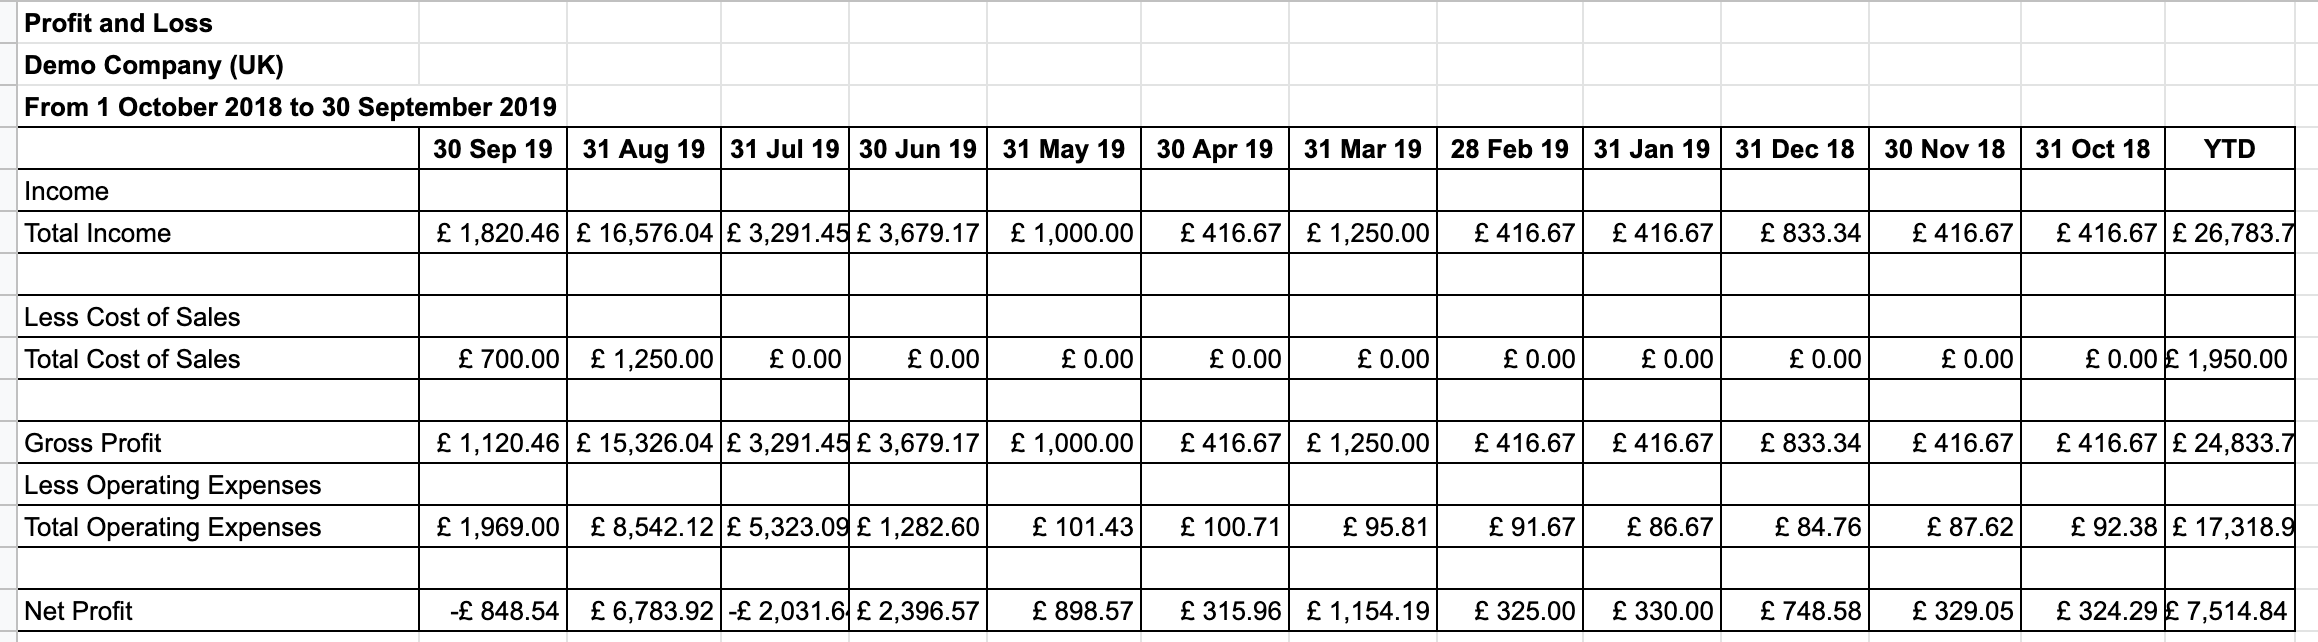
As G-Accon's data has been refreshed, the Profit and Loss report and its chart has been updated accordingly.