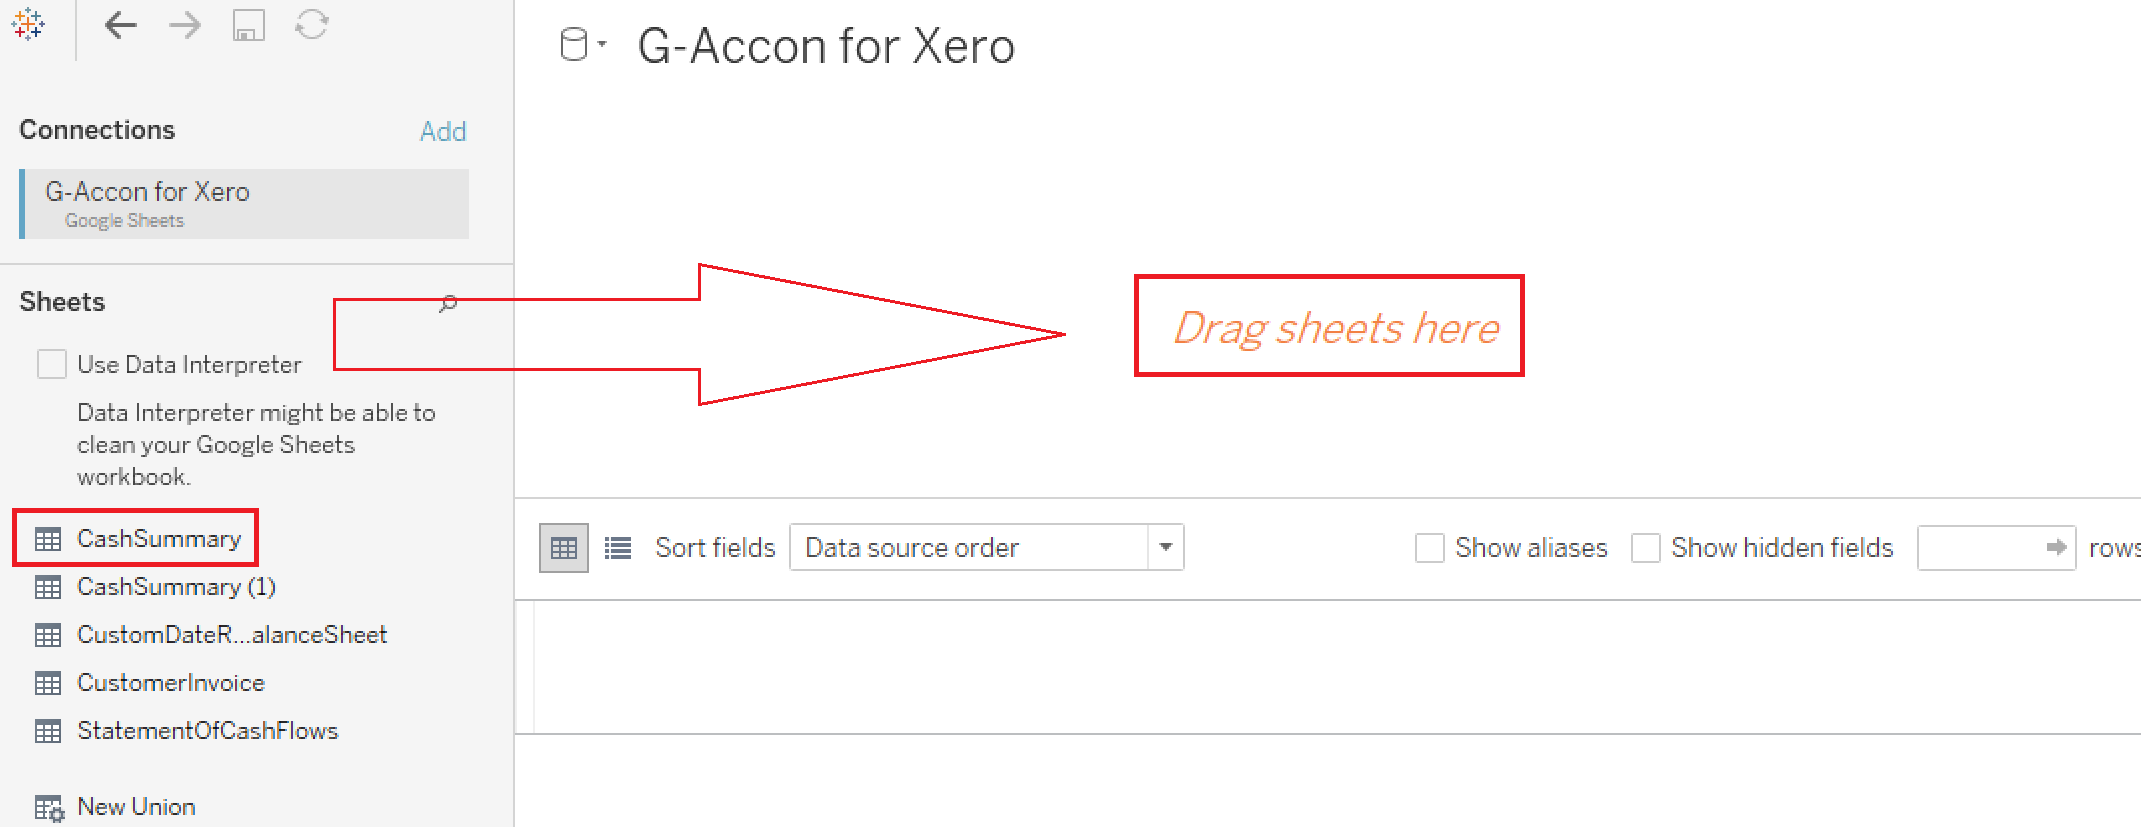
In order to see the graph representation, you need to select a sheet from the left site and drag it to the main area.
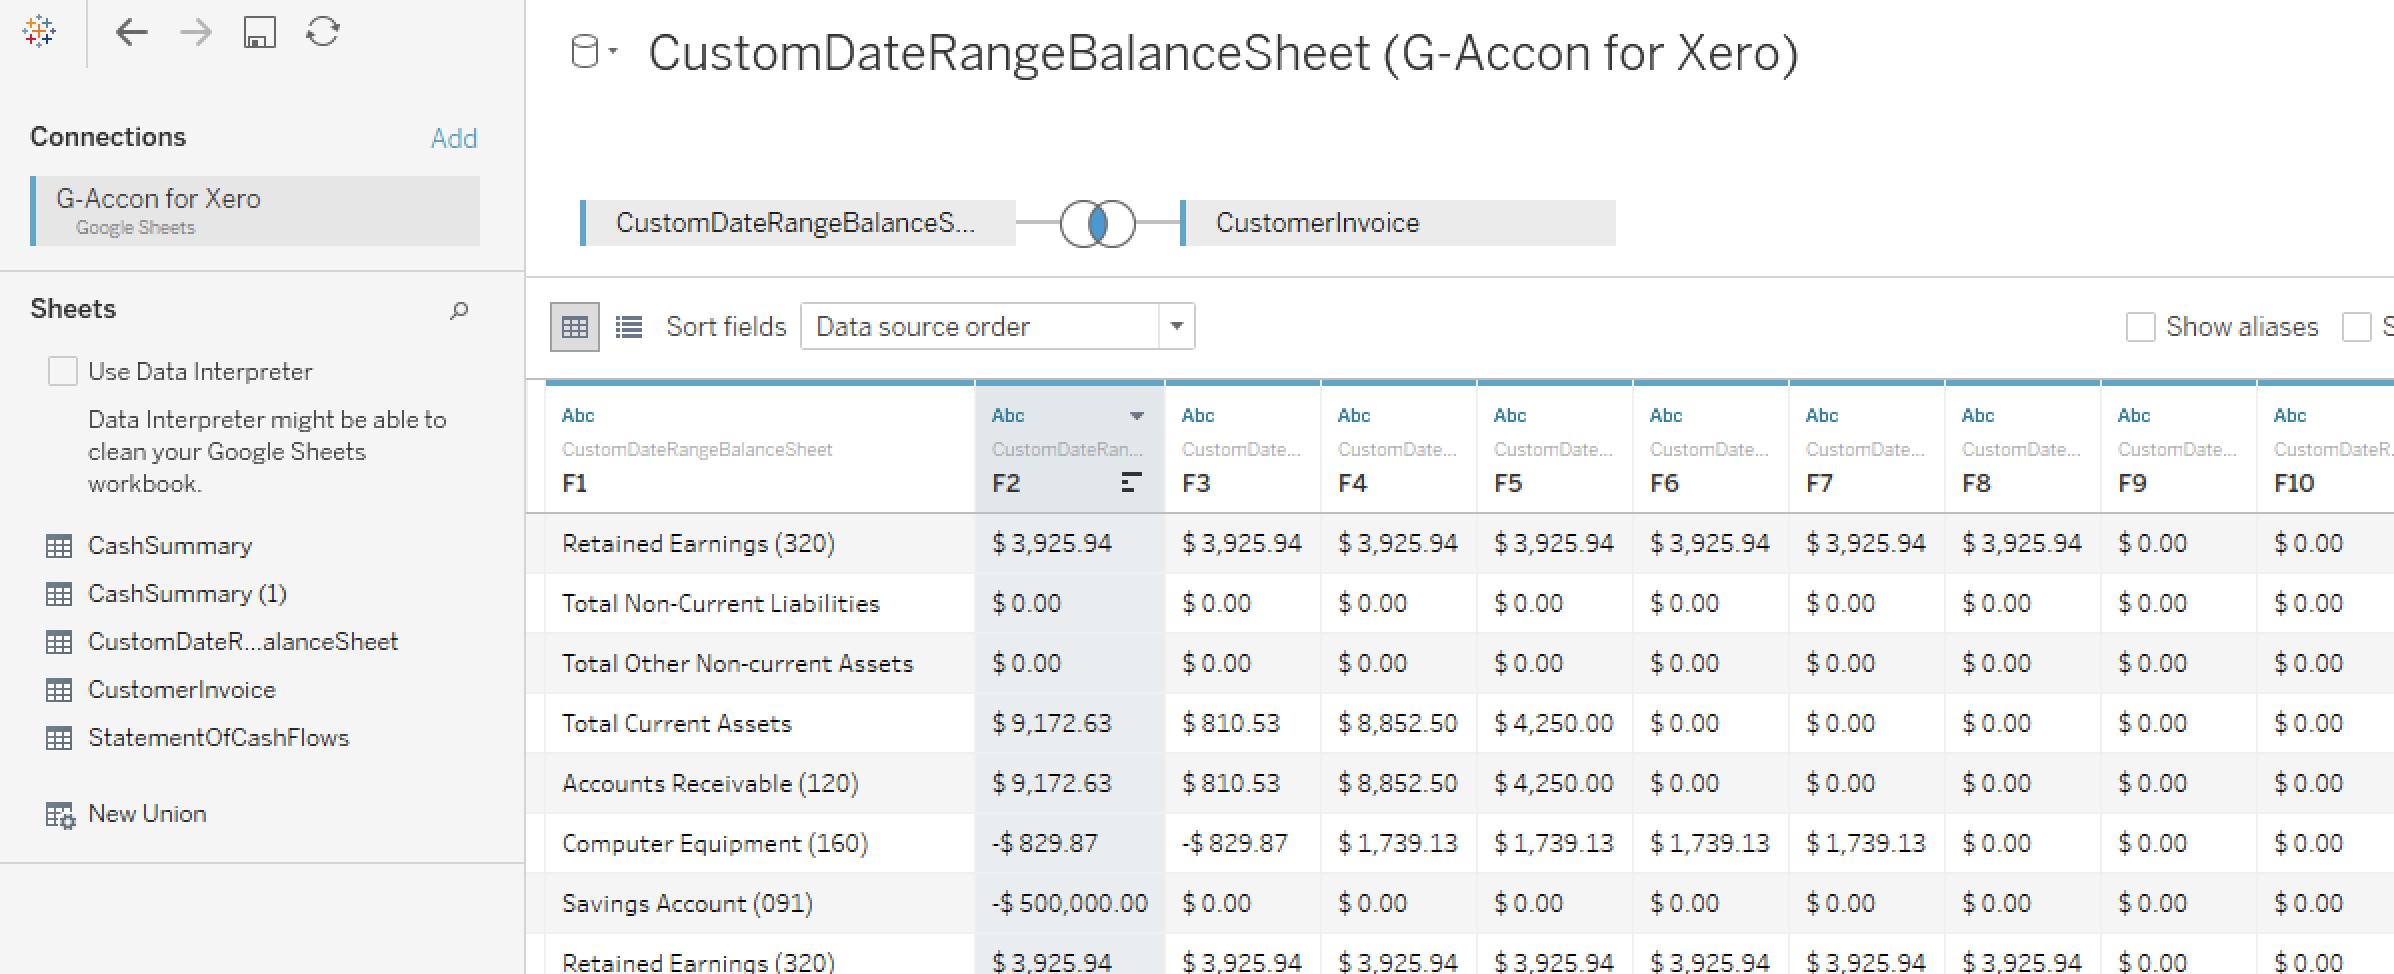
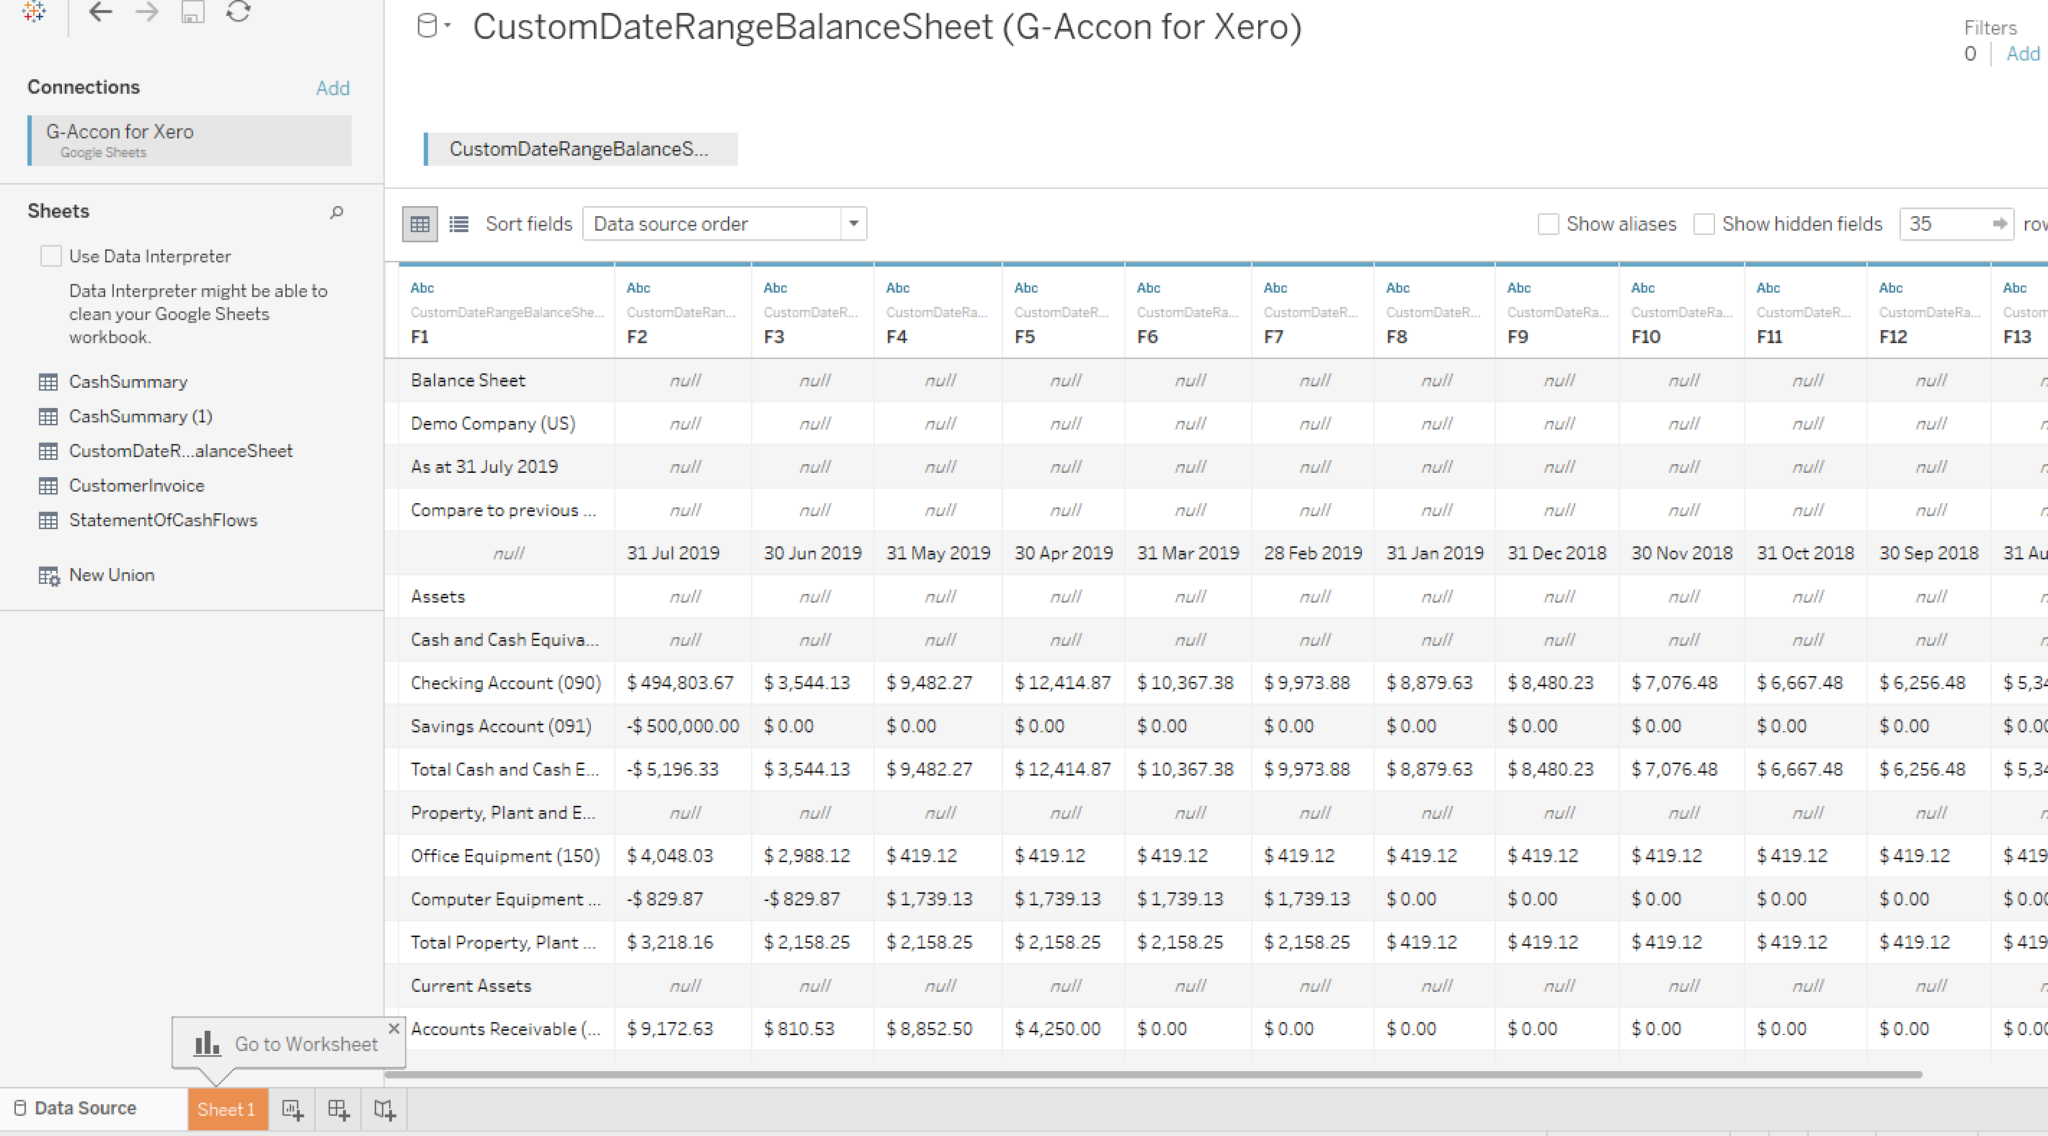
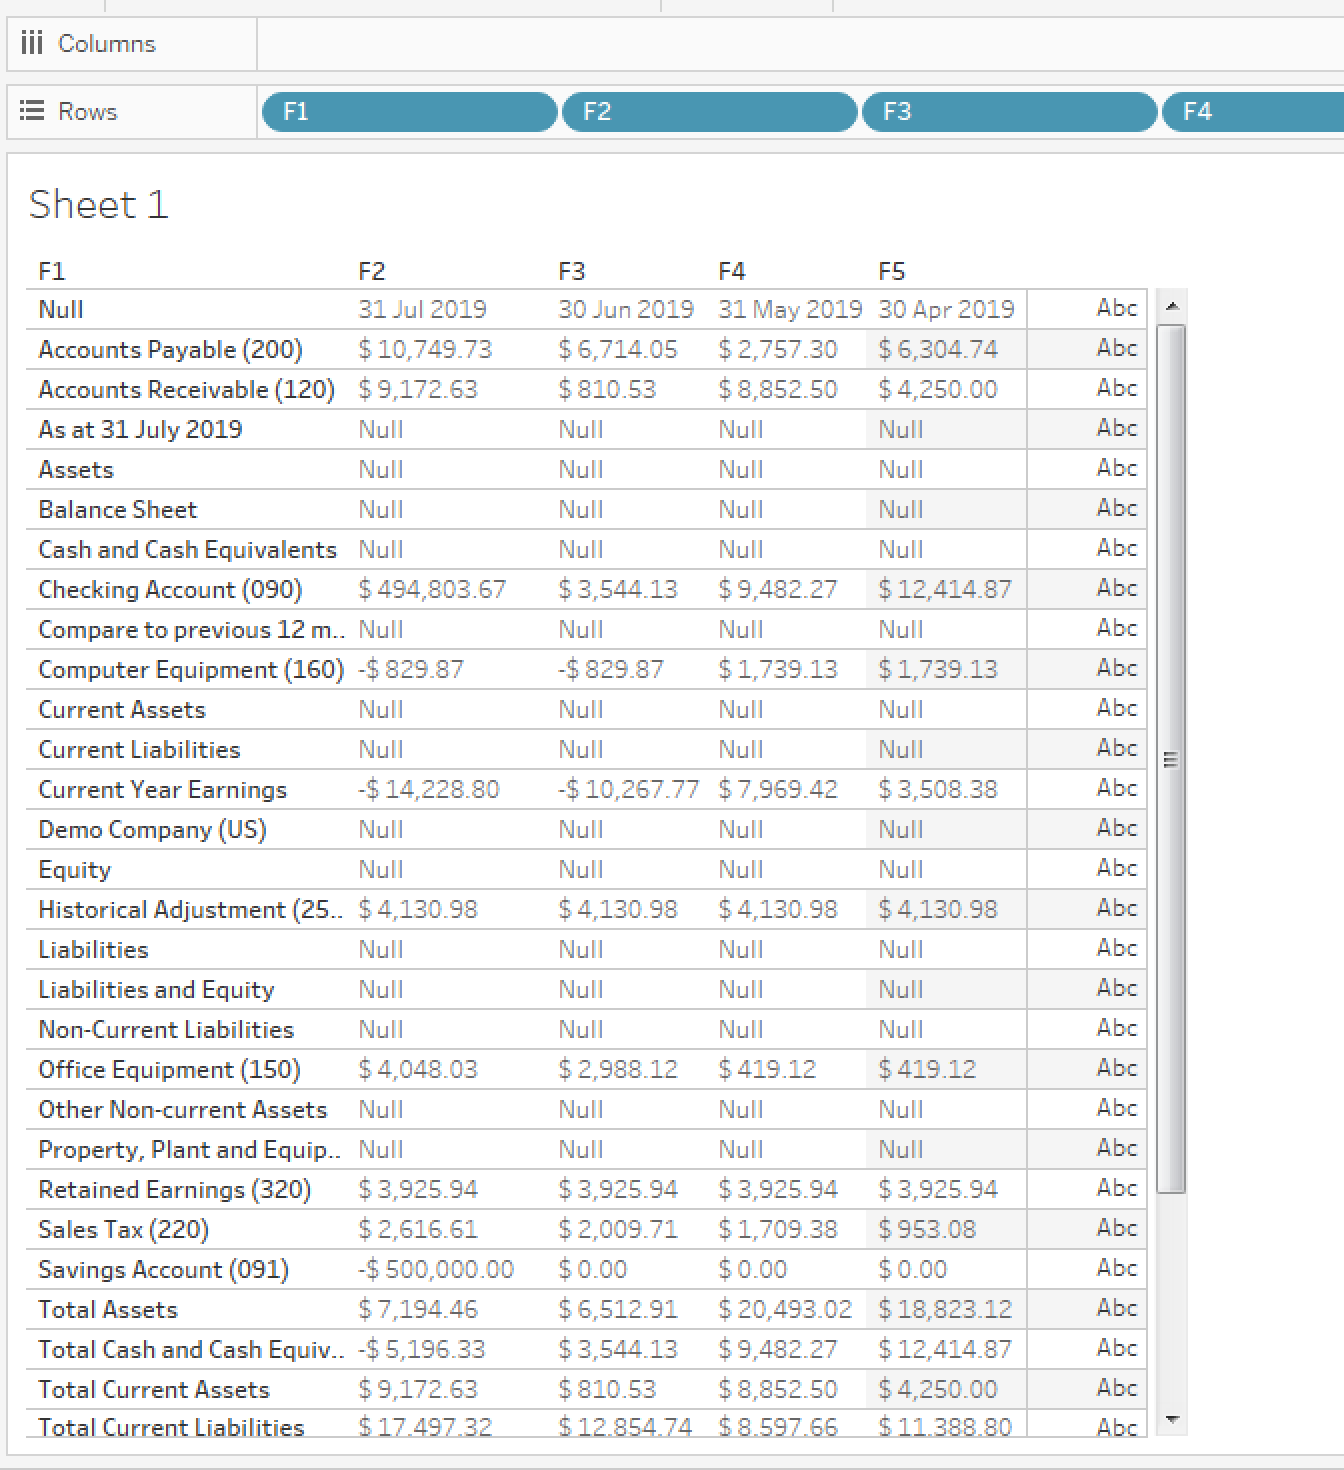
After you drop the G-Accon Google Sheet in the designated area, you should see the following screen - data is moved to Tableau table.
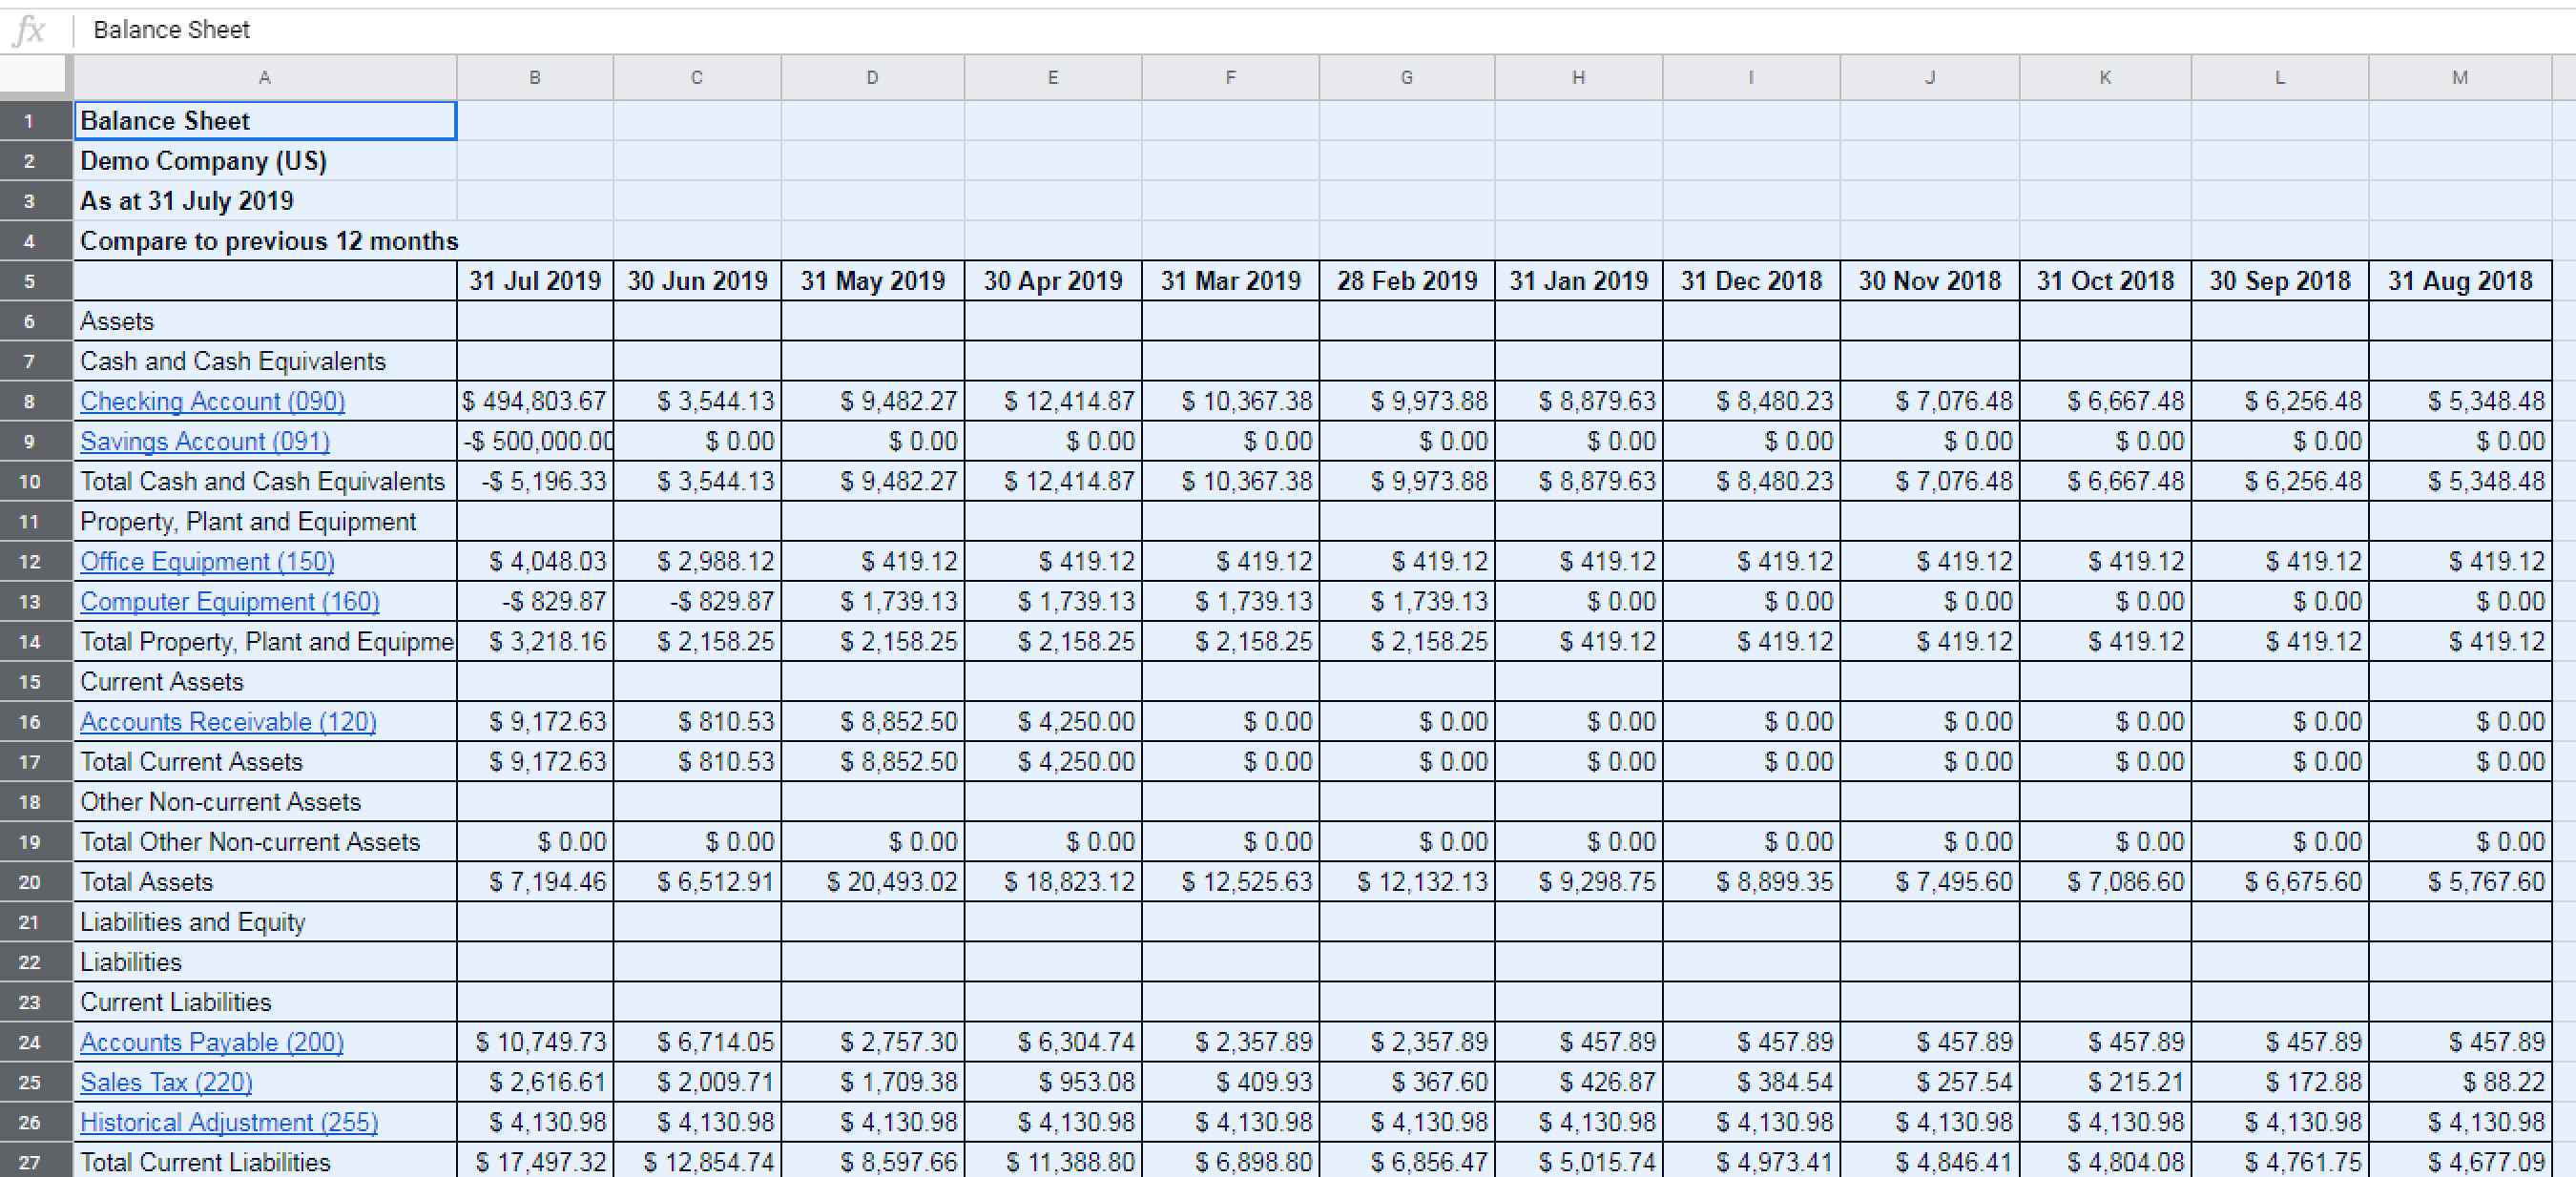
This is the original G-Accon for Xero Google Sheet:
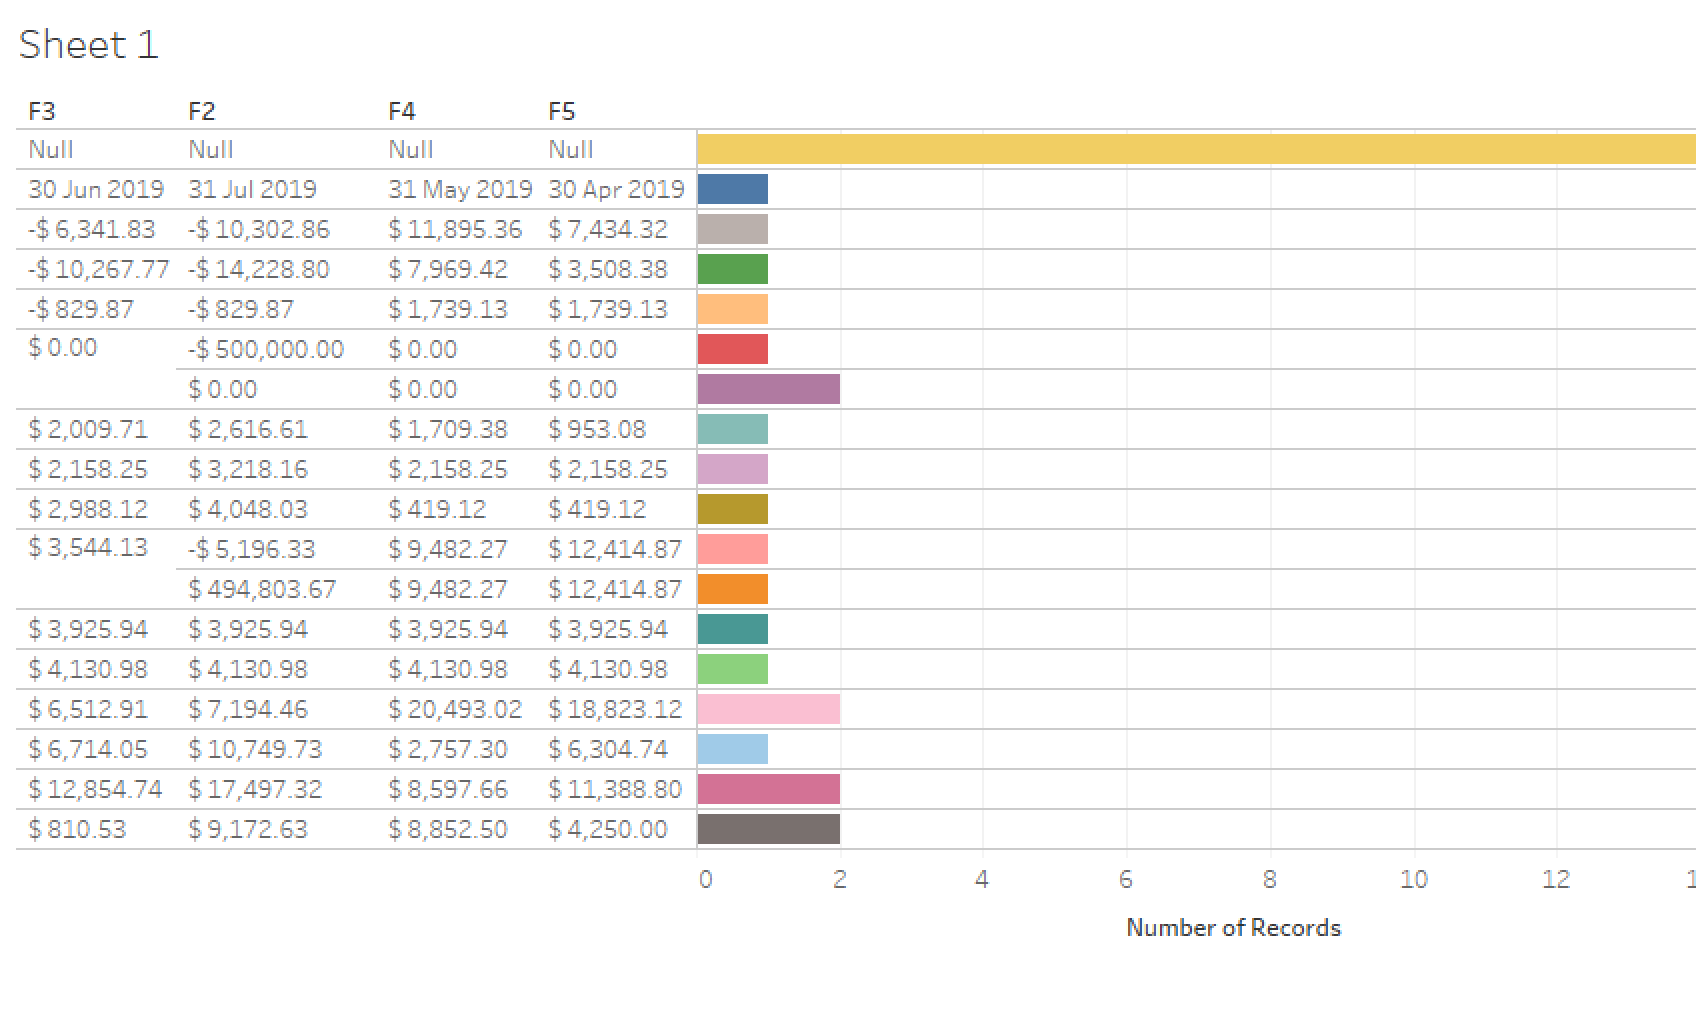
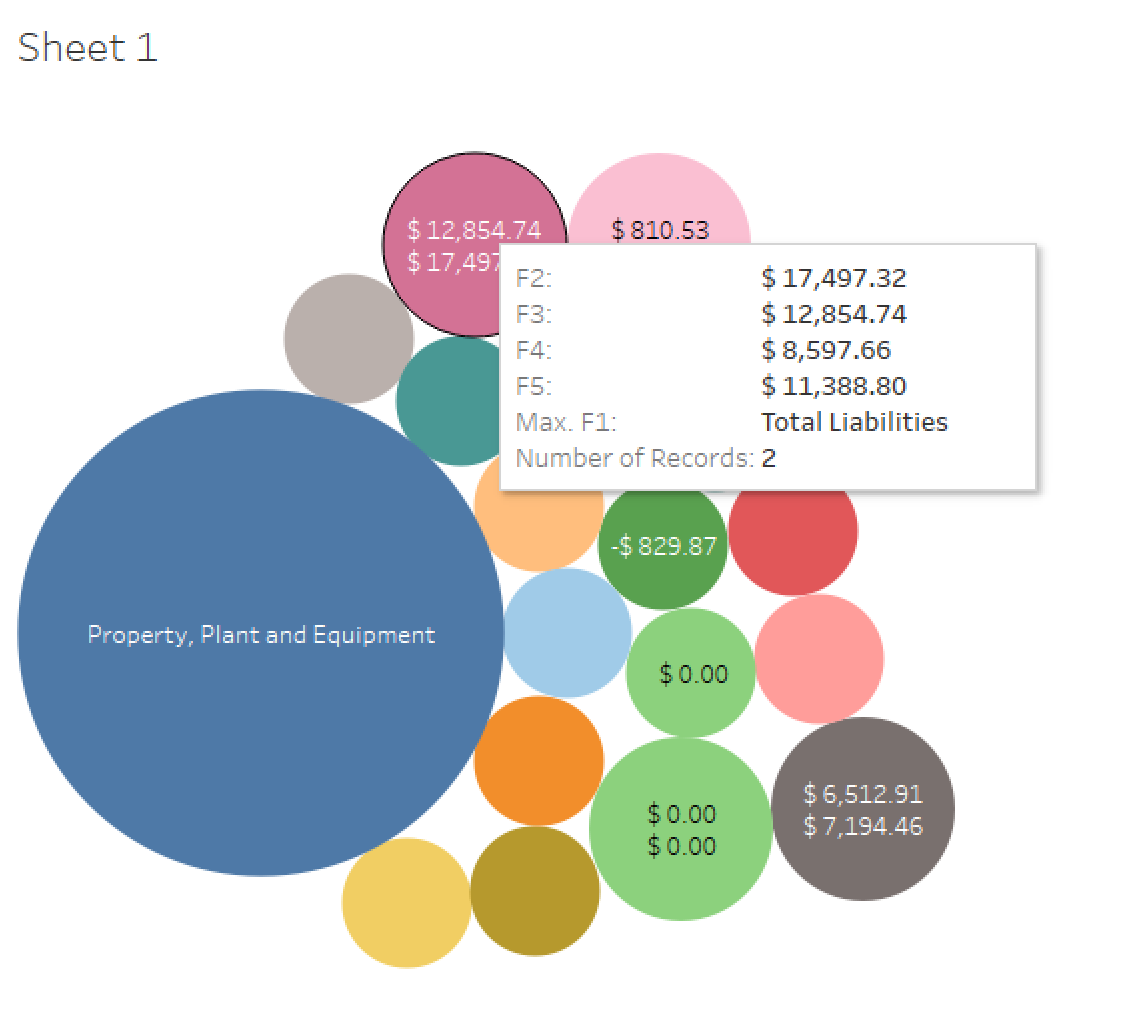
Now you can use Tableau application to visually represent your financial (Xero/QuickBooks) or marketing (WorkflowMax/CRM) data.
You can connect to more than one table by using join.